

Non-aqueous chip performance
EC-MS Technical notes #4
- Last updated

Introduction
In this application note, the performance of non-aqueous chips is compared to that of standard chips. Exposure of standard chips to non-aqueous liquids results in breaching of the membrane and renders the chips useless, thereby making electrochemical studies in non-aqueous electrolytes impossible. Furthermore, standard chips have limited lifetime if when exposed to aqueous media with pH higher than 11. Non-aqueous chips are designed to withstand exposure to non-aqueous solvents and aqueous solutions at any pH and thereby allow for electrochemical studies using these types of electrolytes.
Highlights
- Non-aqueous microchip stability has been demonstrated in Isopropanol (IPA), Tetrahydrofuran (THF), and 1.0 M aqueous potassium hydroxide solution (KOH)
- Similar time response as standard microchips for certain gas compounds
- Similar performance as standard microchips (e.g. regarding sensitivity etc.)
Exposure to IPA and THF
To test non-aqueous chips for exposure to organic solvents, the following procedure was used:
- A non-aqueous chip was mounted on the EC-MS system following standard procedure
- A mass spectrometry multiple ion detection (MID) measurement was started in Zilien
- The EC-cell was equipped with a Pt working electrode and mounted on the interface block
- Isopropyl alcohol (IPA) was injected in the cell (approximately at 160 s in Figure 1. The IPA signal is represented by the red trace)
- IPA was removed, the EC-cell was removed and cleaned (approximately at 500 s in Figure 1)
- The EC-cell was mounted again (approximately at 550 s in Figure 1)
- Tetrahydrofuran (THF) was injected in the cell (approximately at 600 s in Figure 1. The THF signal is represented by the blue trace)
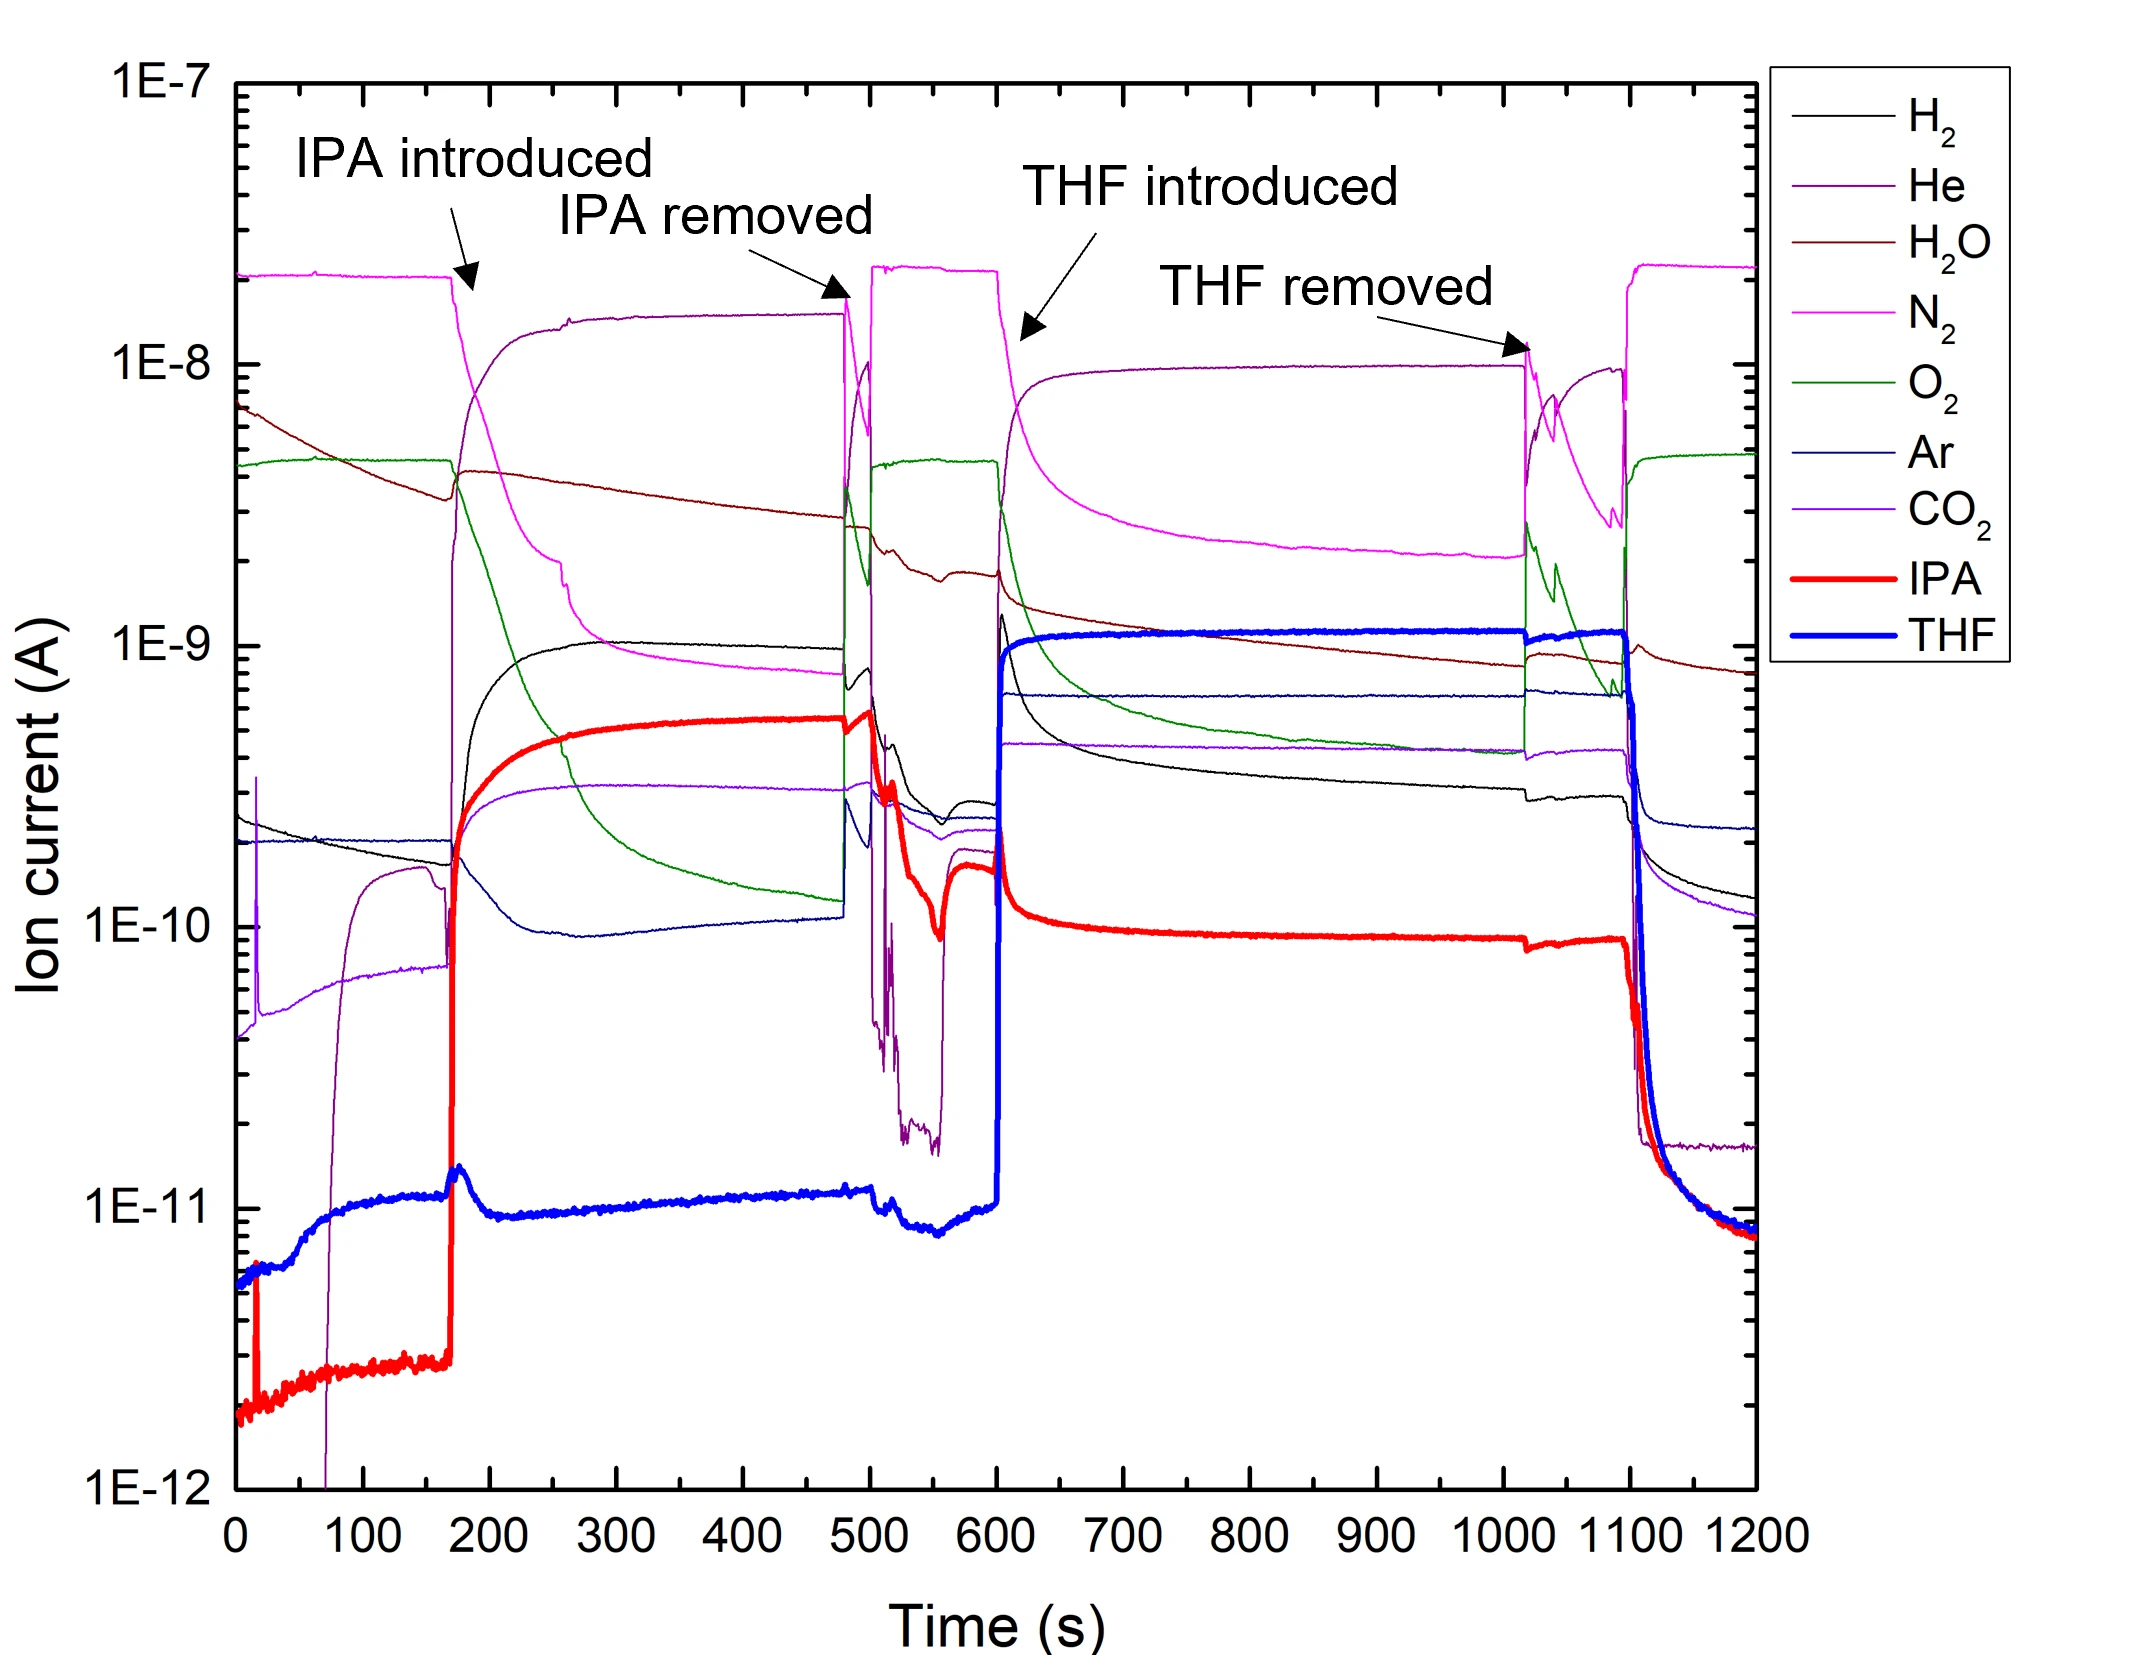
Figure 1 caption: MID signals for non-aqueous chips exposed to IPA and THF in the cell.
As observed in Figure 1, the chip was not breached upon injection of any of the organic solvents. In contrast, using a standard chip would result in the solvent breaching the membrane. A breach can be observed as a sudden increase in the solvent signal, concurrent with a decrease in the top-up gas signal. The MID signal during chip breach of a standard chip upon the exposure to IPA is shown in Figure 2.
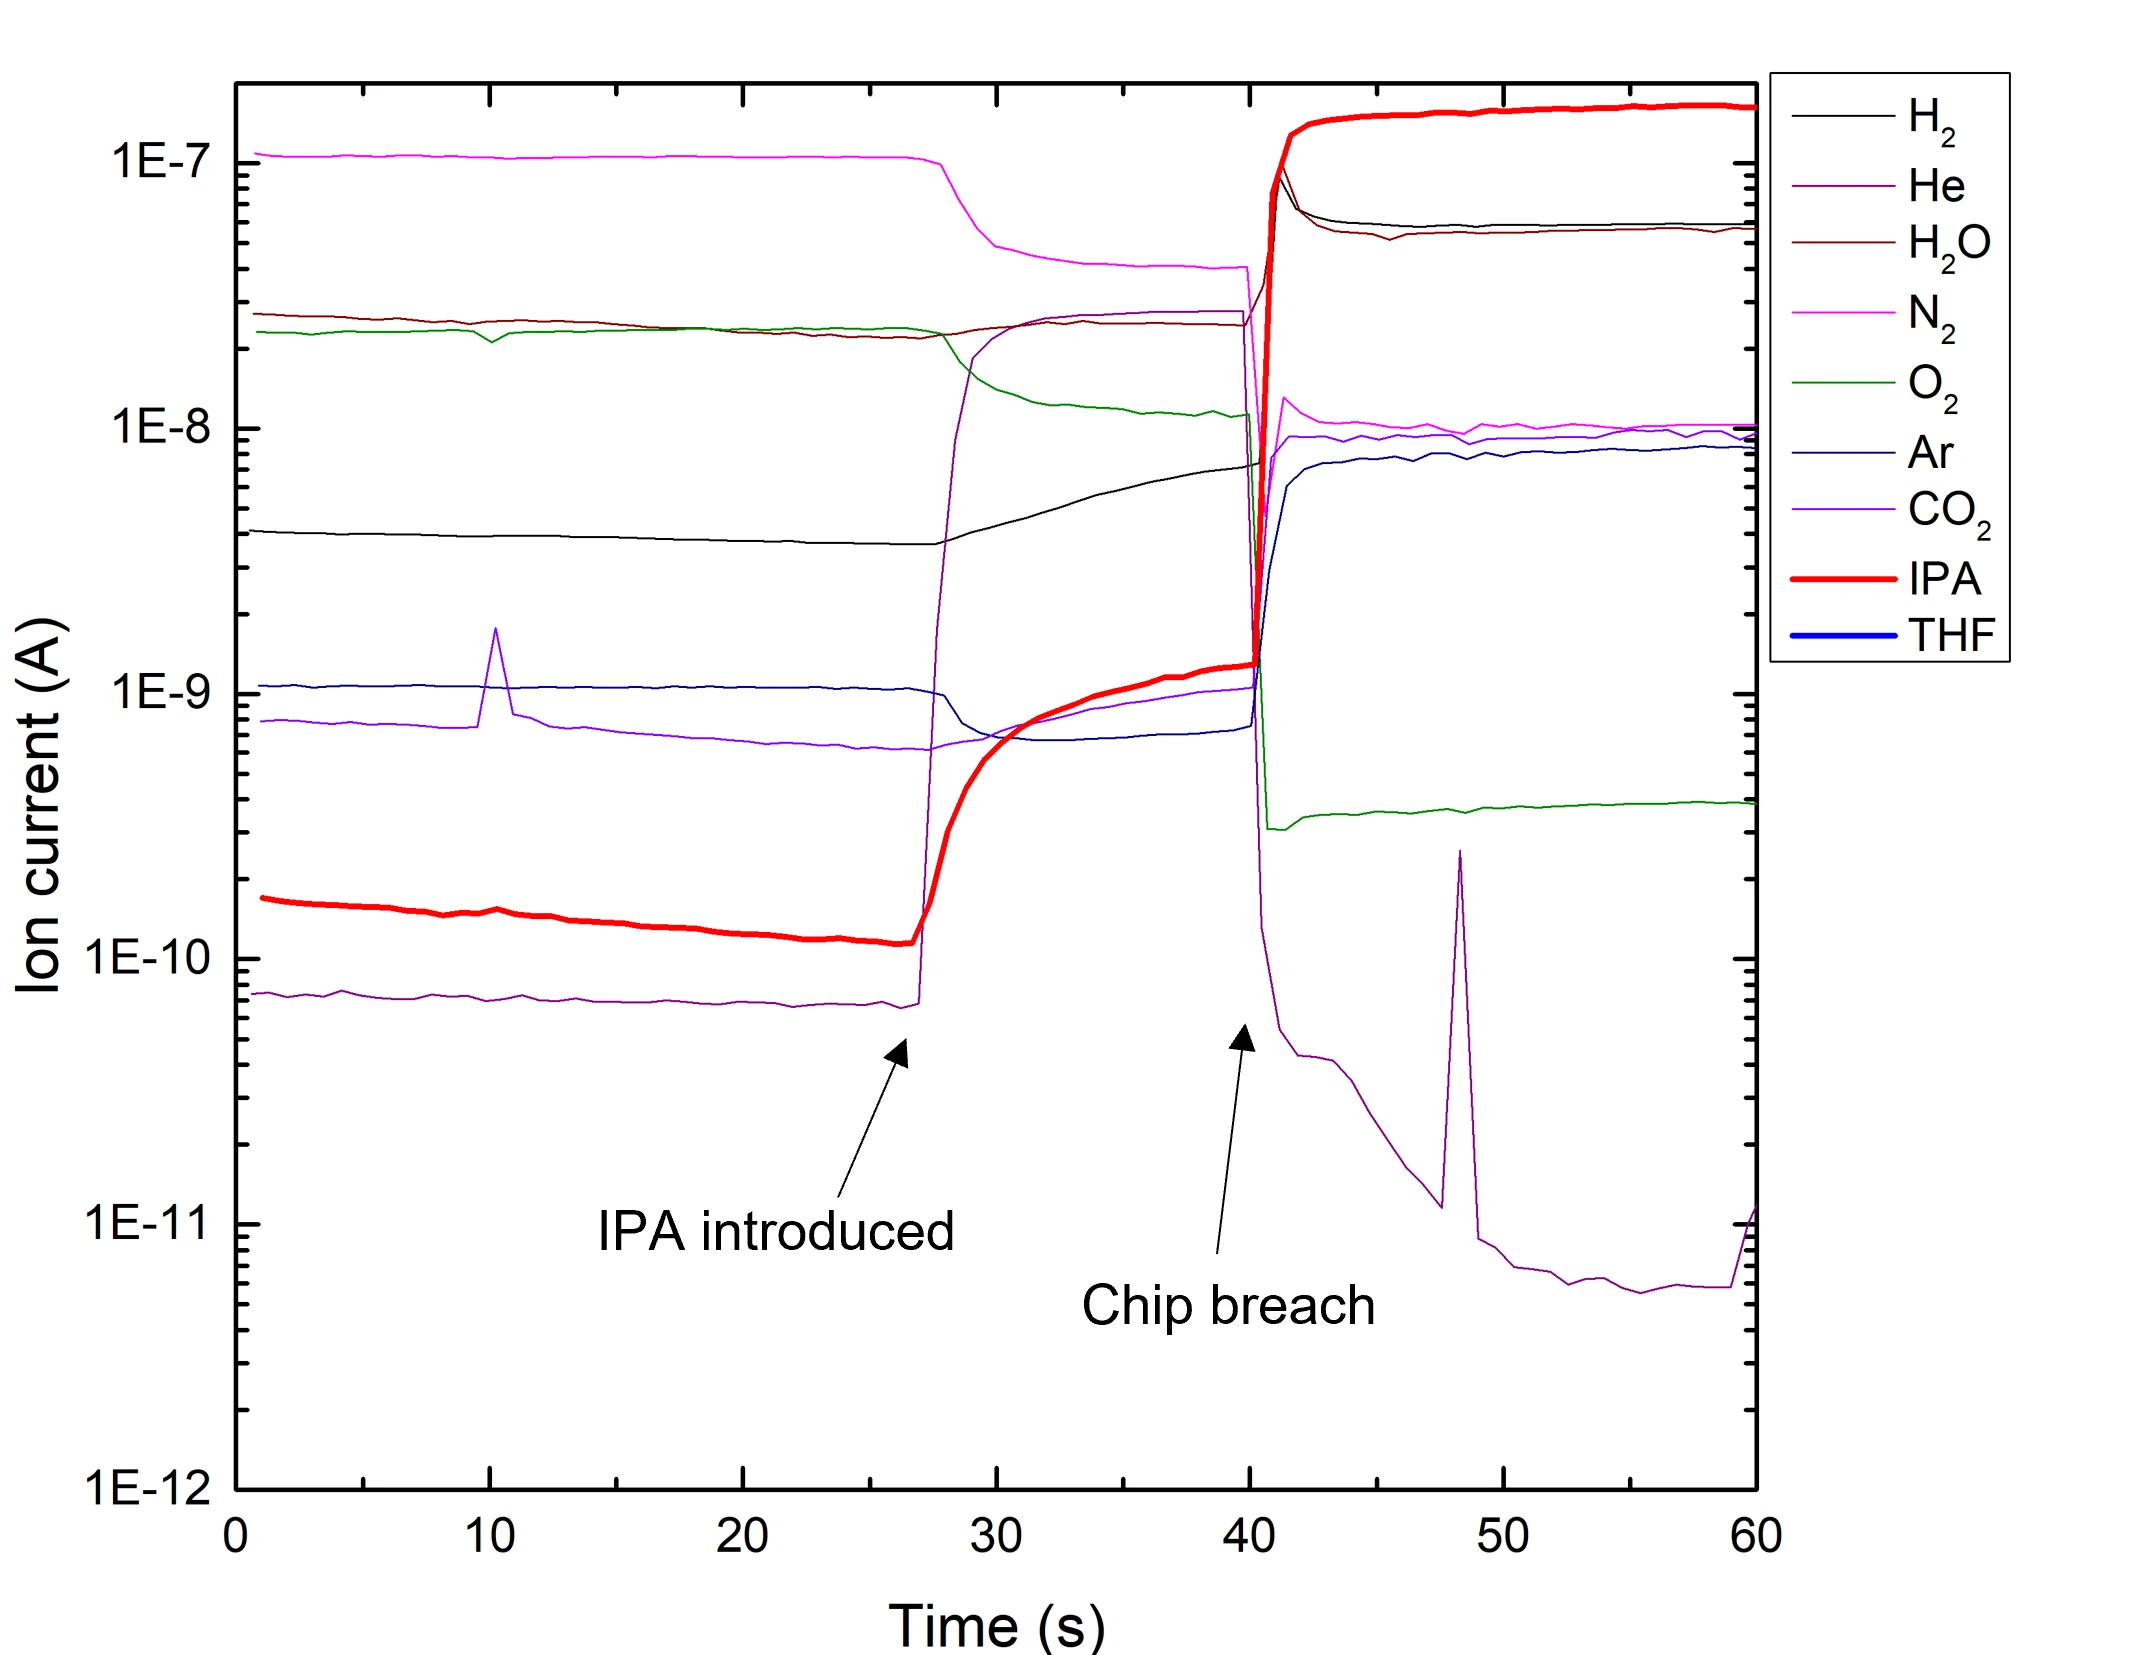
Figure 2 caption: MID signals for standard chip breaching in IPA. At t = 25 s the chip was exposed to IPA, at t = 40 s the chip breaches.
Cyclic Voltammetry Performance
EC-MS data acquired during a Pt cyclic voltammetry experiment in 0.1 M HClO4 electrolyte using a non-aqueous chip is shown in Figure 3. Data for the same experiment performed using a standard chip is also shown for comparison. MID signals recorded with a standard reference and a non-aqueous chip are comparable in intensity and exhibit identical time response. The lower oxygen peak recorded with the non-aqueous chip in Figure 3 is associated with a lower anodic current peak.
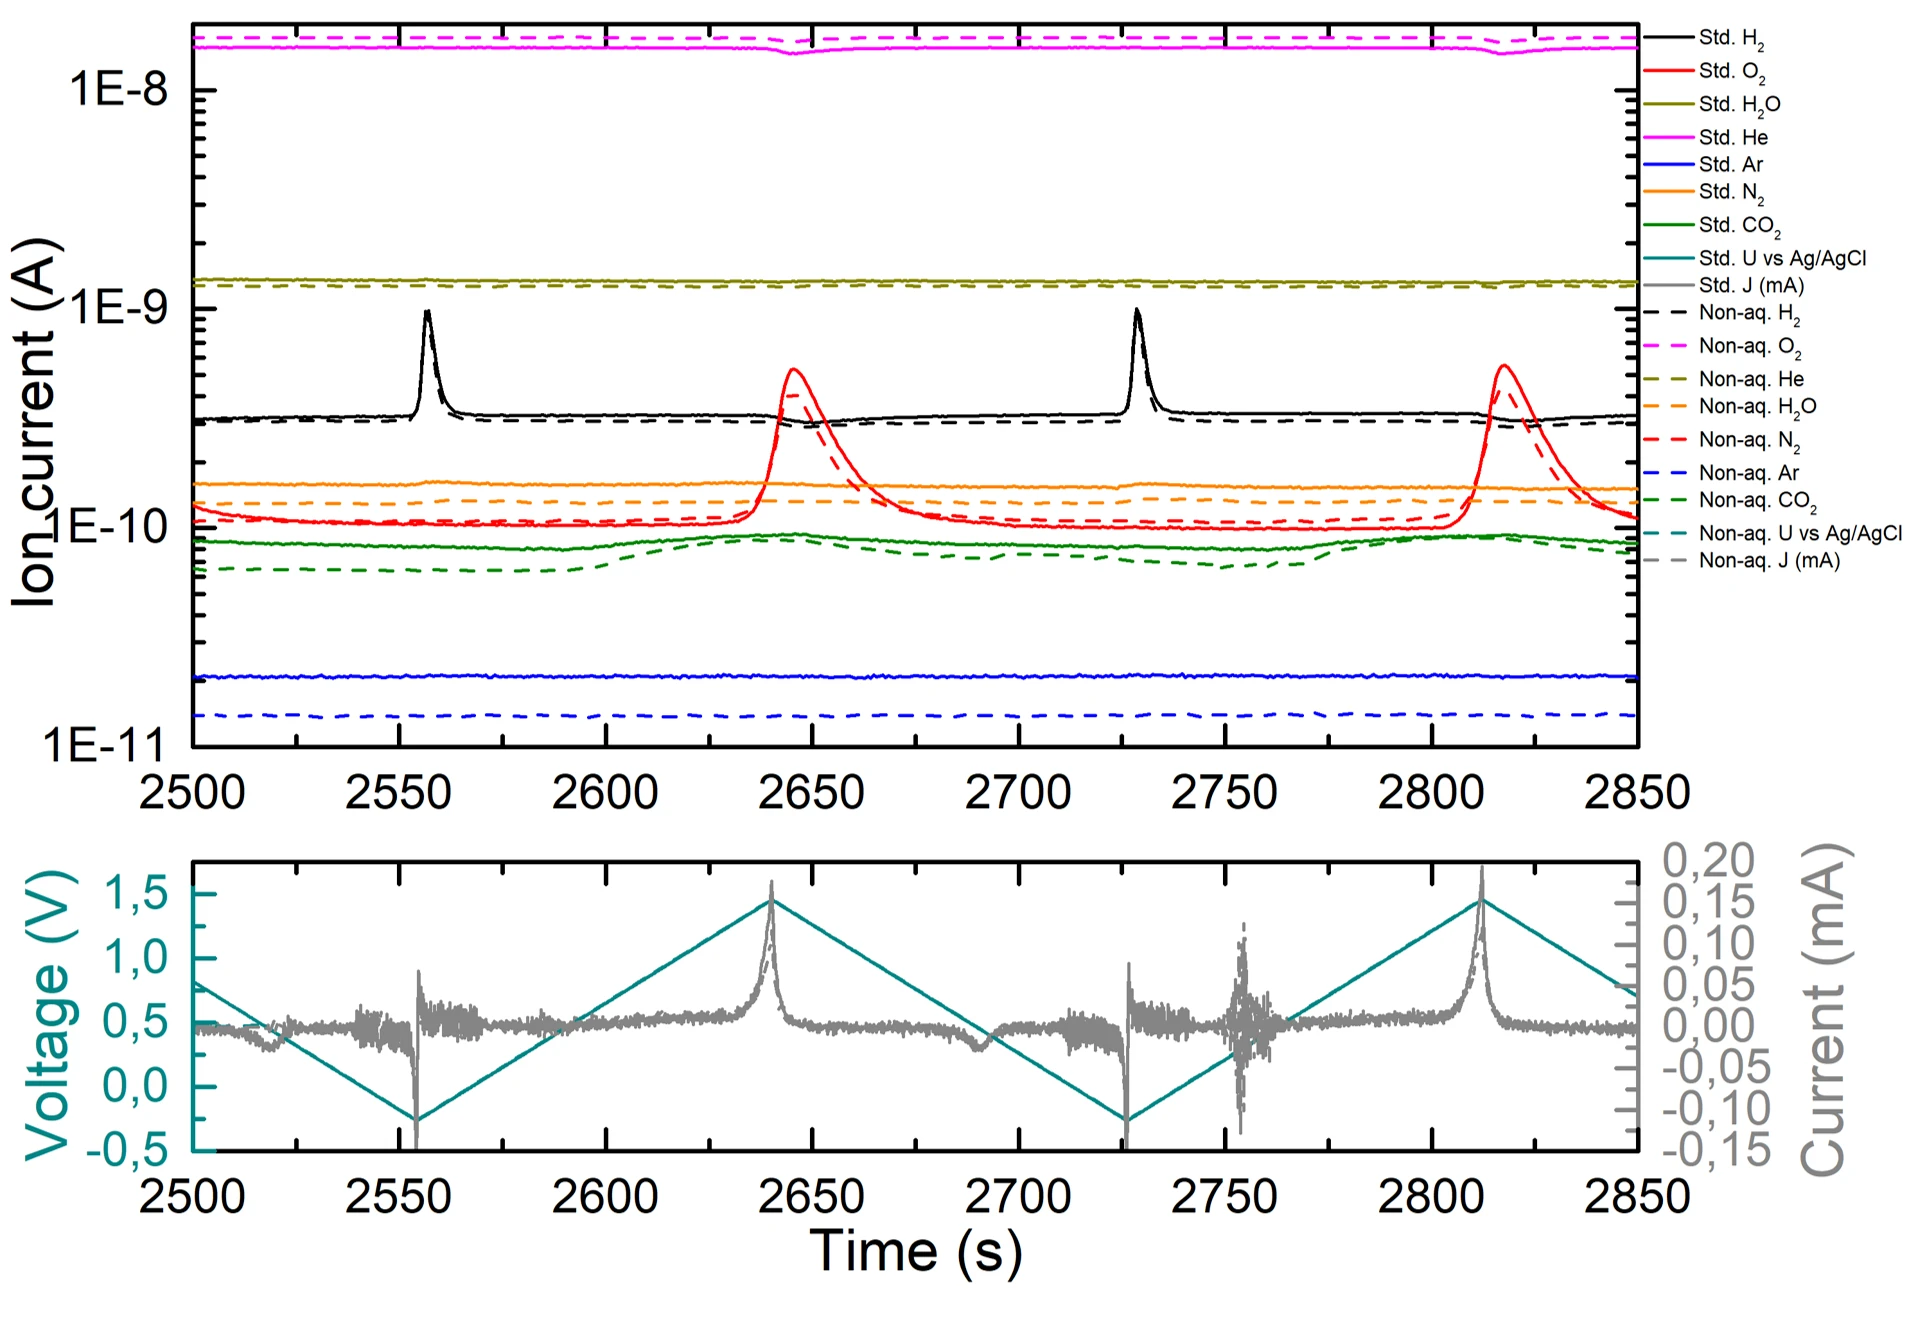
Figure 3 caption: Comparison of CV performance between a standard aqueous chip (full lines) and a non-aqueous chip (dashed lines).
Chronopotentiometry Performance
To quantitatively compare the time-response of an as-produced non-aqueous chip with a standard chip, chronopotentiometry (CP) experiments were performed: The EC-cell was run at constant current following a step function where the plateaus are at +20, 0, and -20 μA, respectively. Each constant current step was kept for 2 minutes. The abrupt current steps allow to produce sharp gas evolution onsets and offsets for oxygen and hydrogen during the anodic +20 μA step and the cathodic -20 μA step, respectively. Fitting a single exponential to the decay tails of the m/z=2 and m/z=32 signals after a CP step yields an estimate of the decay time constant, according to the following equation:
Y(x) = Y0e−xτ (1)
Where in this case Y is the mass spectrometer signal intensity, x is time, and τ is the decay constant. Time constants for the standard and non-aqueous chips, respectively, are identical.
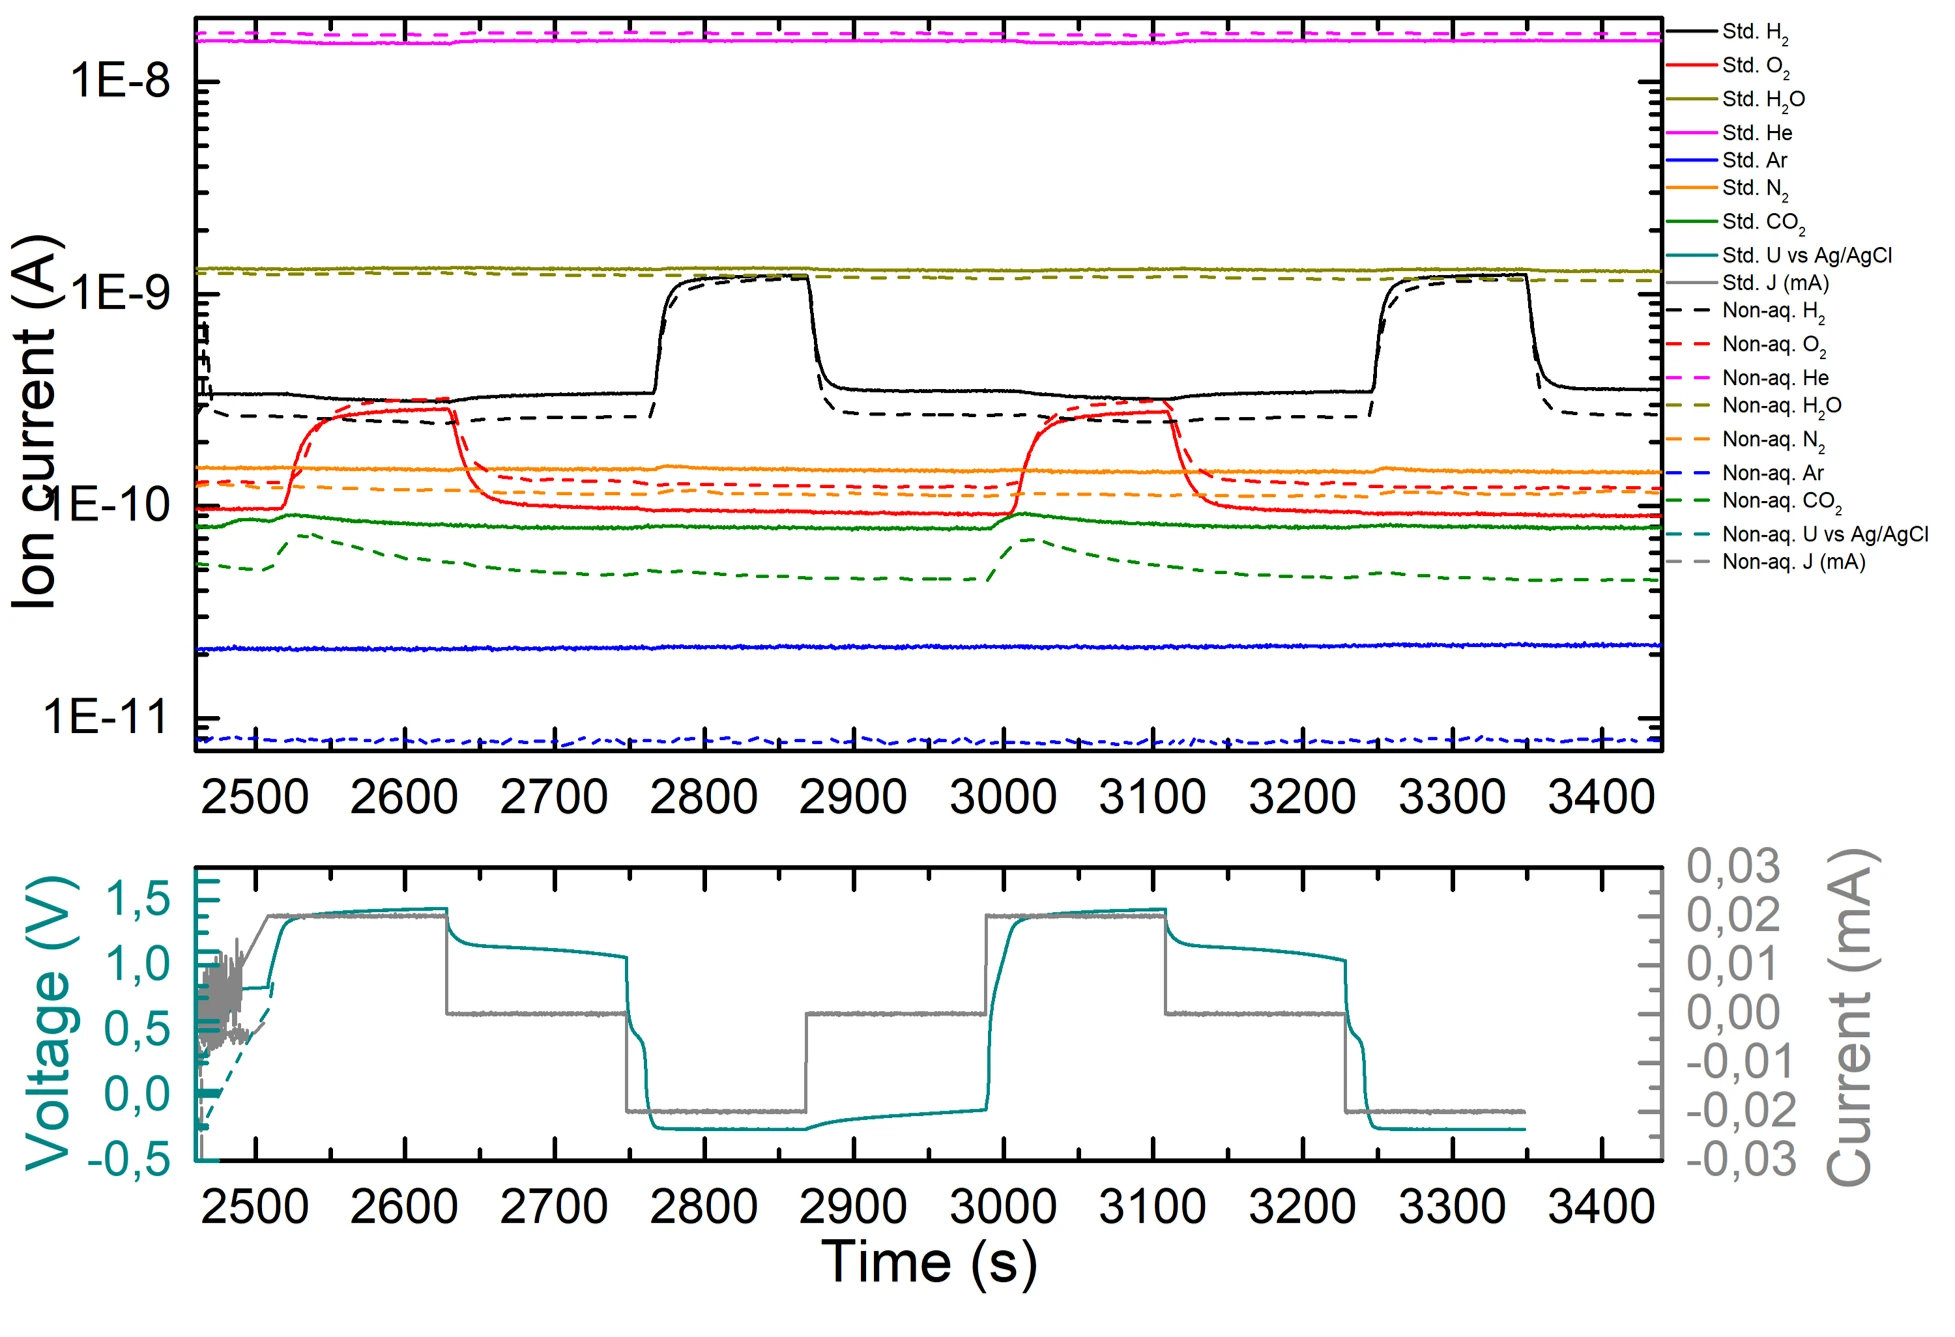
Figure 4 caption: Comparison of CP performance between a standard aqueous chip (full lines) and a non-aqueous chip (dashed lines).