

Avoiding MS‐Signal Fluctuations Caused by Bubbles
EC-MS Technical notes #11
- Last updated

Introduction
The presence of gas bubbles during EC‐MS experiments may negatively impact the quality of both the EC‐ and the MS data, most notably by inducing fluctuations to the MS signal(s). This technical note describes (i) how the problem can be identified (ii) the main factors caus‐ ing the formation and growth of bubbles and (iii) how to avoid or mitigate these issues. The first part of this note deals with bubbles introduced to the cell during the electrolyte injec‐ tion. The second part discusses bubbles and the hereto associated fluctuations occurring in the MS signal during measurement. Finally, a type of fluctuations denoted air spikes will briefly be introduced.
Bubble formation during electrolyte injection
Tests have shown that it is not uncommon for bubbles to be created during the injection of electrolyte into the thin layer of the EC‐cell, e.g. if the mounting is done incorrectly or the necessary preparations are not in order. This section describes how this issue is identified and which steps should be taken to resolve it.
Identifying the issue
Gas bubbles, typically within the thin layer volume of the EC‐cell, may cause slow time‐
response or erratic behavior of MS signals as well as irregular EC measurements and even
loss of potential control. Bubbles within the EC‐cell naturally cannot be seen once it is
mounted, but fluctuations of the MS signals related to the constituents of atmospheric air
(e.g. N₂, O₂, Ar) can indicate the presence of an air bubble. Although these bubbles may
also affect the measurement of non‐atmospheric species, e.g. their time response, the main influence is observed directly on the measurement of atmospheric species.
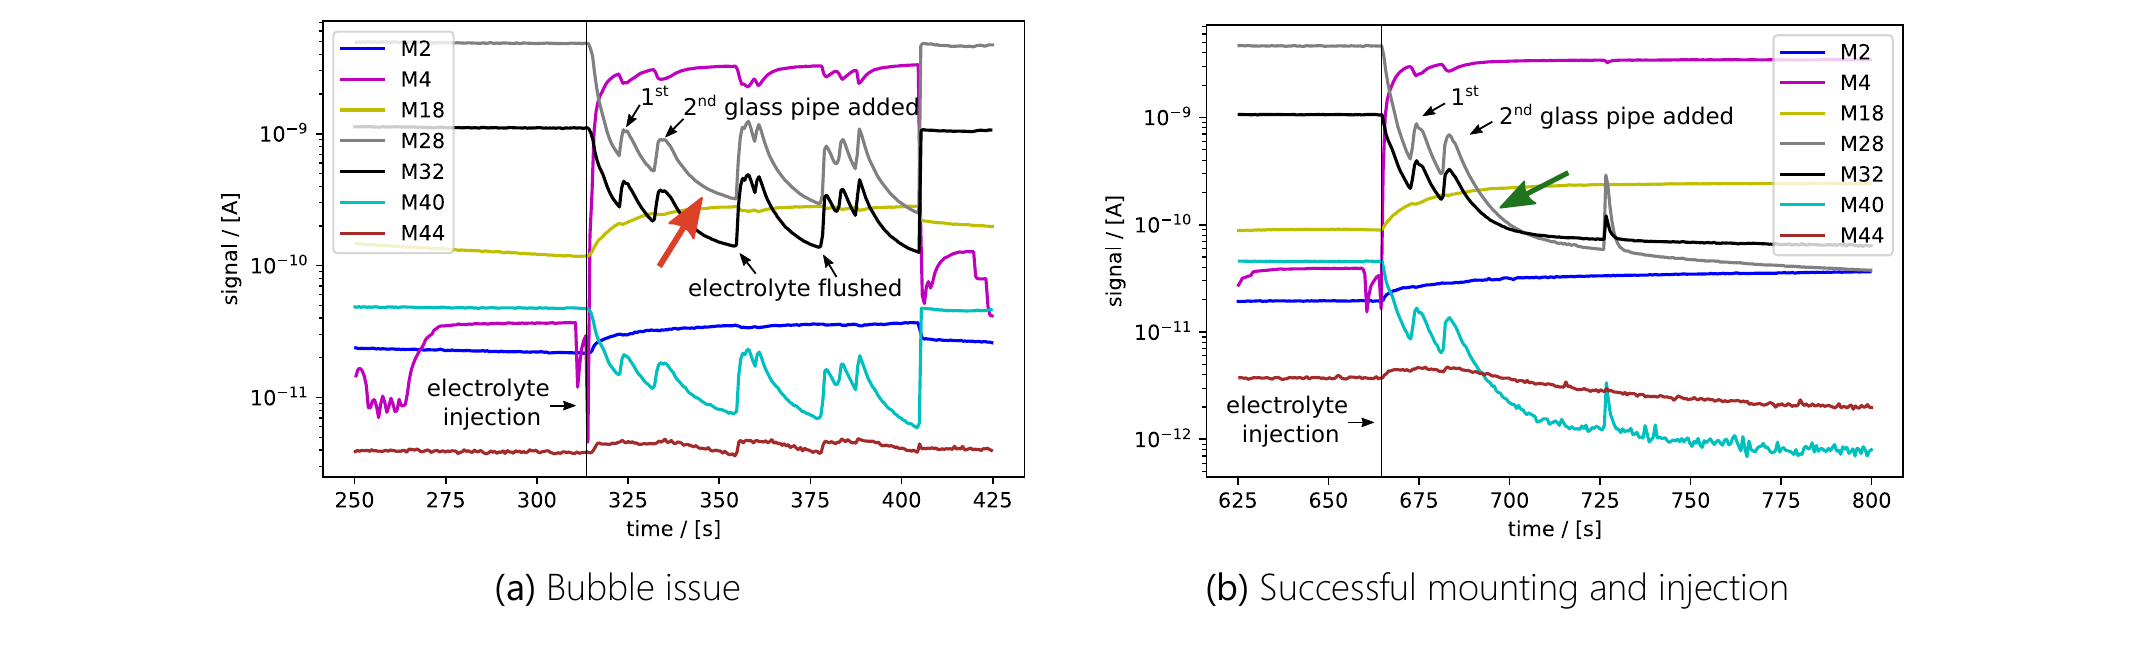
Figure 1: Examples of MID signals during electrolyte injection showing indications of a bad (a) and a good (b) injection. If a bubble is present (a) the M28 and M32 signals will decrease at the same rate (red arrow). Conversely, in the absence of bubbles (b) the relative M28 signal decrease compared to the M32 occurs faster (green arrow) than in the presence of a bubble. In the instance of (b) we observe that repeated flushing with electrolyte does not remove the bubble.
Figure 1b shows the MID plot of a successful start of a typical experiment. Here the cell
is mounted (∼ 625 s) and electrolyte is injected at ∼ 670 s, causing an abrupt increase in the signal of the make-up gas (He, M4) and an increase of signals M2 and M18 related to the aqueous electrolyte, simultaneous with the decay of atmospheric signals. Next, when inserting the glass pipes into a Luer adapters, more air-saturated electrolyte is pushed into the cell, observable as brief spikes in M28, M32, M40 at 675 s and 680 s. After this, all signals stabilize at reproducible levels. Notably, the M28 signal initially drops faster than the M32 signal (green arrow in the figure). In contrast, Figure 1a shows the start of an experiment where bubbles are present: After electrolyte injection the atmospheric signals drop relatively slower, stabilize at a higher level and M28 drops at a similar rate as M32 (red arrow in the figure). At ∼ 355 s and ∼ 380 s more electrolyte is injected (as indicated by the spikes in atmospheric signals) in an unsuccessful attempt to flush out the bubble(s). If a bubble is introduced into the thin layer part of the EC-cell, they can usually not be fully removed by retracting, refilling or flushing the electrolyte. Consequently, we recommend to remount the cell while paying attention to the procedure and the key points which are described below.
Preventing bubble formation
In order to mount the cell, all components should be clean, completely dry, free of any damage and precisely assembled, to give the best conditions for the electrolyte injection. The major issues that may lead to bubble formation during electrolyte injection are:
(i) Damage to surfaces such as scratches, flakes or strands (common on U-cup, O-ring and EC-cell edges).
(ii) Residue, dust, liquid or moisture anywhere on chip, sample disk, U-cup, or cell (includ-ing O-ring and Luer connectors).
(iii) Improper electrolyte injection or bubbles from the syringe volume.
(iv) Improper mounting of disk or U-cup assembly.
If indications of bubbles are seen, the cell should be remounted using the following steps:
- Dismount the cell, rinse (e.g. in ultrapure water) and dry all components thoroughly. Take out the O-ring, so that both the groove beneath the O-ring and the O-ring itself may be properly rinsed and dried as well.
- While the O-ring is off, check the alignment of the disk electrode and U-cup relative to the body of the cell and adjust for ideal alignment.
- Visually inspect that all components are in good shape and reinstall the O-ring and remount the cell.
Please keep in mind the common issues (i-iv) when (re)mounting the cell. The issues are exemplified and elaborated on below.
Issue (i)
Figure 2 exemplifies how an air pocket/bubble may form during electrolyte injection into the EC-cell. In this case the bubble is caused by a damaged U-cup. The Figure 2 panels display the injection of electrolyte (green color) frame by frame, starting from the completely empty cell (leftmost image) to a completely filled cell (rightmost image).
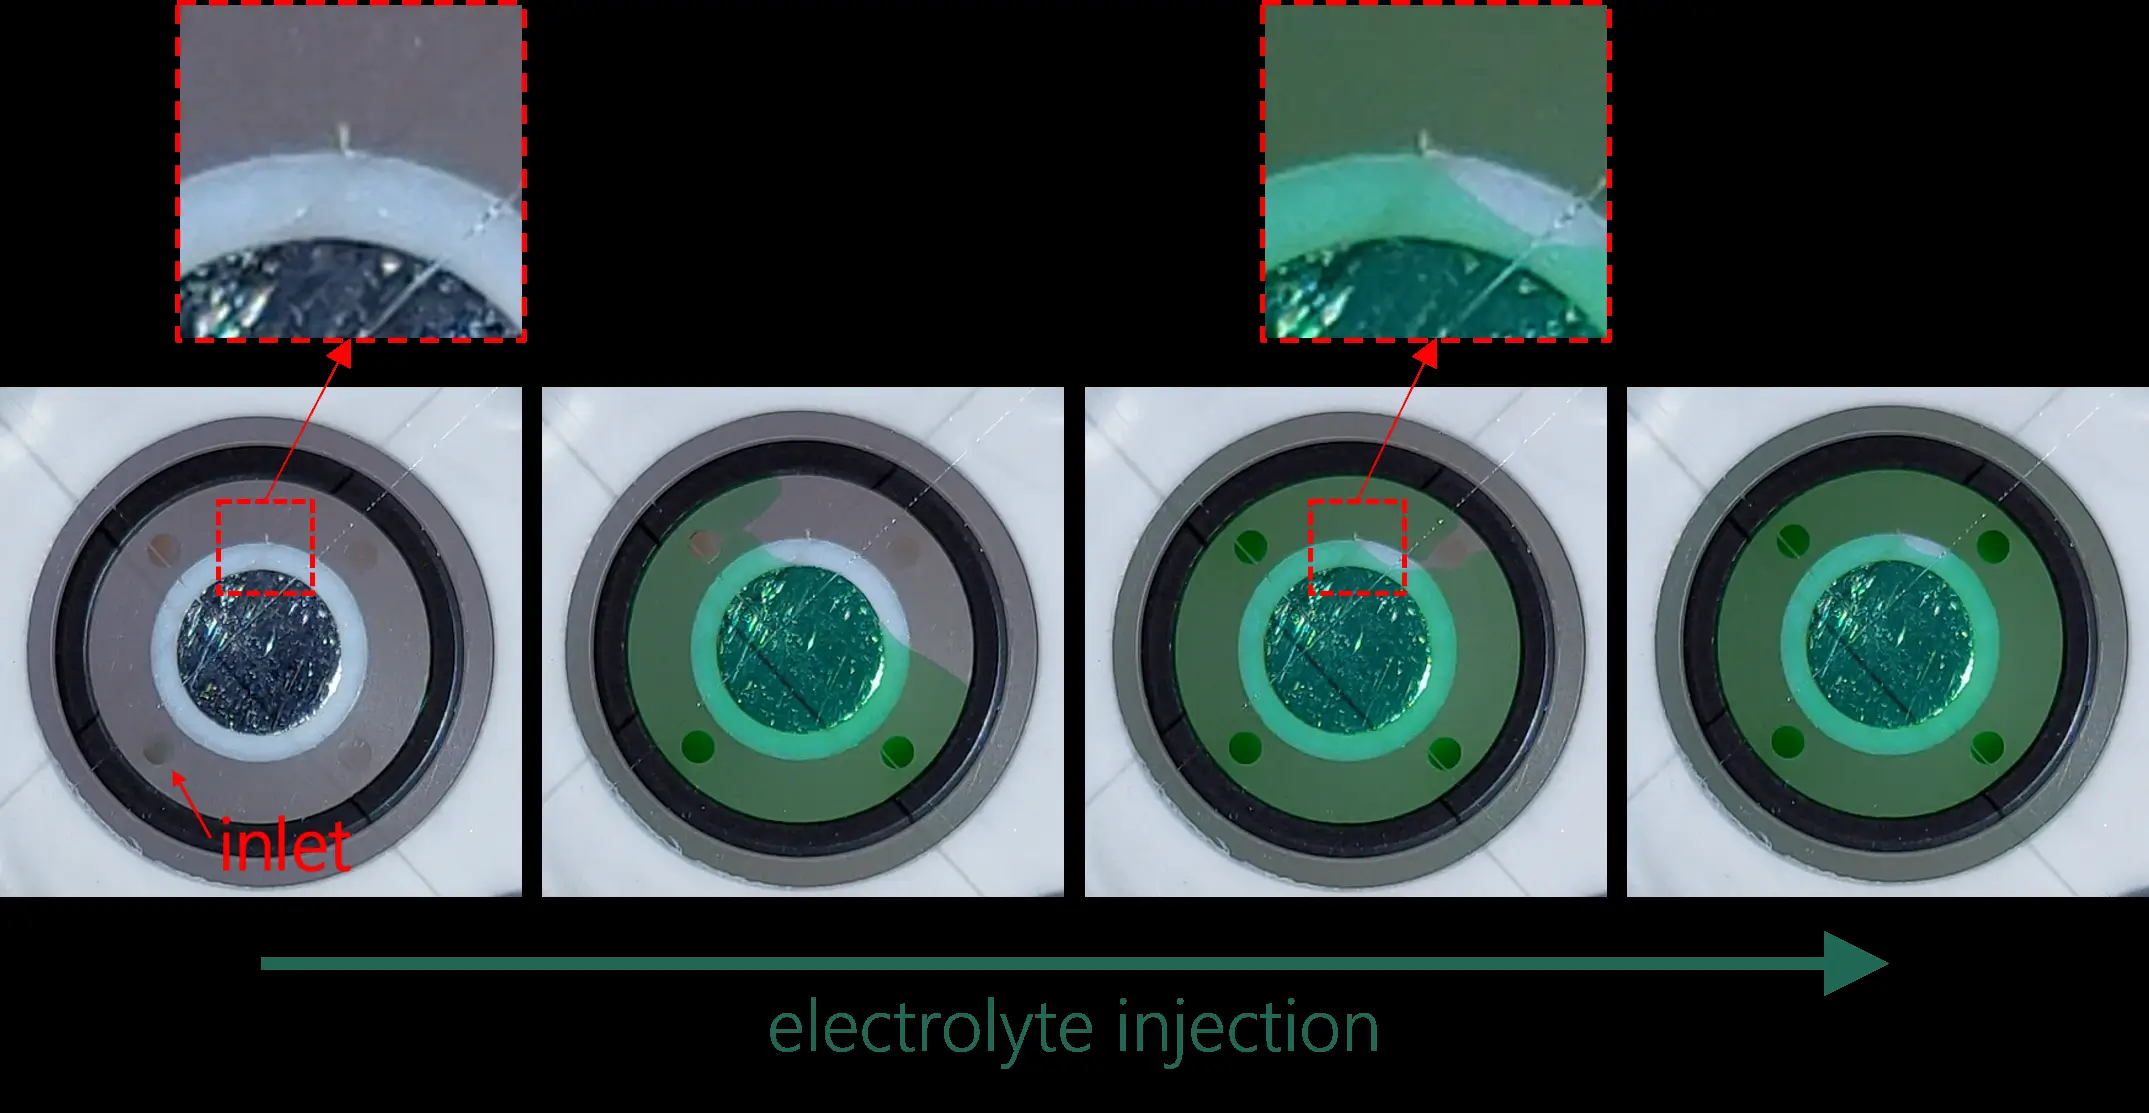
Figure 2: Four video snapshots (chronologically left to right) showing bubble formation in the thin layer EC-cell during electrolyte injection. Electrolyte is injected via the inlet filling the thin layer volume in ∼1 s. A small strand of PTFE on the U-cup perimeter (left inset) repels the electrolyte (right inset) obstructing the filling and consequently forming an air bubble. To allow visual inspection, the EC-cell was mounted on a customized transparent plate following the regular EC-MS mounting procedure. The O-ring (black) defines the lateral extent of the electrolyte volume whereas the 100 µm PTFE spacer defines the height of the thin layer volume.
insets highlight the area in the interface between U-cup (bright white) and the cell (dull translucent) in which a strand of PTFE protrudes from the edge of the mounted U-cup causing the issue. Within the confined space of the thin layer volume, see Figure 2, a small
protrusion of a small hydrophobic strand from the U-cup obstructs the complete filling of electrolyte resulting in a dry spot – i.e. a bubble of atmospheric gas within the electrolyte phase. This example highlights how a non-ideal surface may affect the electrolyte injection. Special care should be taken to ensure the integrity of all components, especially those of hydrophobic and/or soft materials which are prone to deformation, i.e. U-cup and O-ring. We recommend visually inspection of components prior mounting (e.g. using a magnifying glass or microscope) and their replacement if they show signs of wear and tear.
Issue (ii)
The phenomenon observed in Figure 2 may also arise if residues, contaminants or precip-itates are present within the cell. This includes liquid, e.g. remaining electrolyte droplets, as multiple liquid-gas interfaces may lead to trapping of bubbles within the cell. Hence, meticulous cleaning and drying of the cell and its components minimizes the risk of such problems. To ensure the cell is completely dry, it may be stored in a desiccator, a lab-oratory drying oven (at a suitable temperature) or blow-dried with (oil and particle free) compressed air. We also recommend to blow-dry the cell immediately before mounting to remove any particulates or dust.
Issue (iii)
Improper electrolyte injection may also introduce or facilitate bubble nucleation in the cell. For example, bubbles residing in the electrolyte syringe may be transferred into the cell during injection (see Figure 3, top left image).
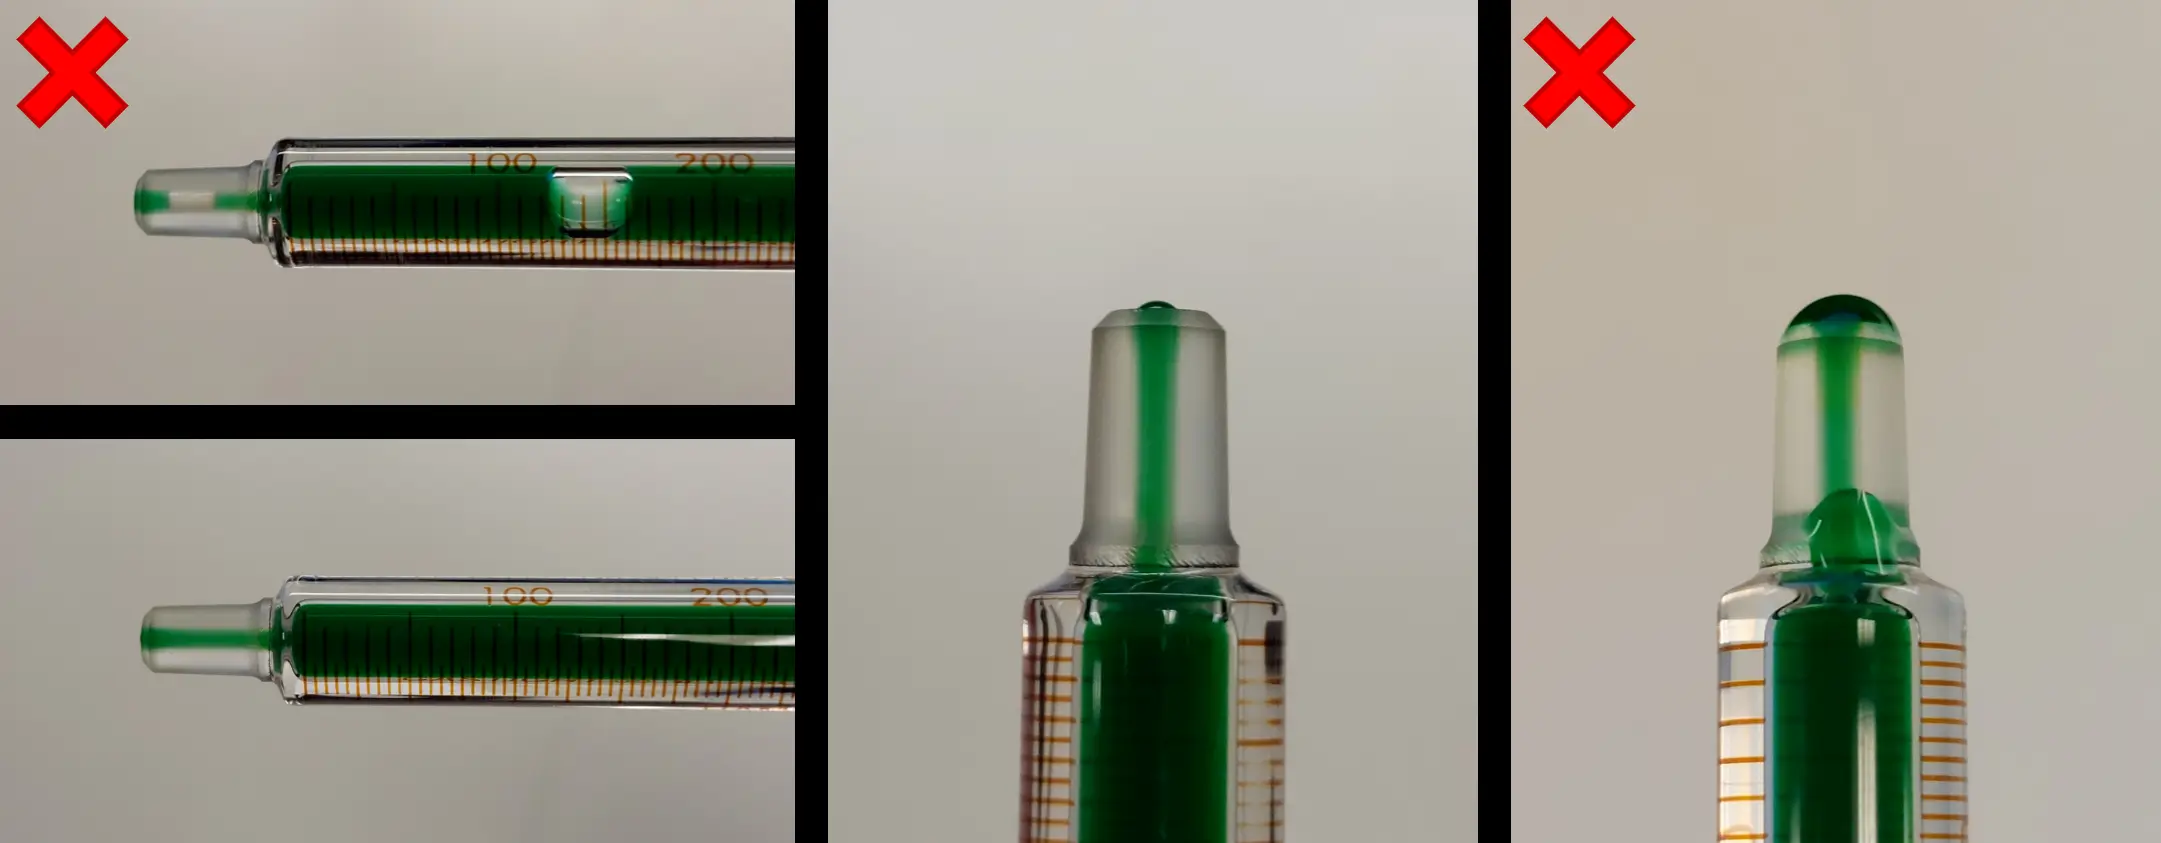
Figure 3: Utilizing a syringe with bubble free electrolyte and ensuring that only one liquid-gas interface is present within the syringe minimizes the risk of introducing bubbles into the EC-cell. The left images show a Hamilton syringe when bubbles are present (top) and when filled properly (bottom). Note that both bubbles in the tip and the body of the syringe are problematic. Furthermore, the syringe should have a small meniscus (middle image) upon insertion and injection into the cell as excess droplets (right image) may cause issues.
Ensure that the entire electrolyte volume (both syringe body and tip) is completely bubble free as seen in Figure 3 (bottom left). Also ensure that there are no trapped bubbles below the frits of the glass pipes, as these may affect both MS signals and conduction needed for the electrochemical measurements. A needle syringe can be used to flush out these bubbles.
Issue (iv)
A poor mounting of the disk electrode and U-cup assembly in the EC-cell may also lead to bubbles or unwanted effects. The sample and U-cup should be completely flush with the face of the EC-cell as seen on the right image in Figure 4. If the sample or U-cup are protruding (left) or indented (middle), bubbles may nucleate or attach more easily on the exposed edges. Any protrusion can obstruct electrolyte injection and result in an only partially filled cell. If the sample is indented, the time response of the products detected with the MS may also be slower, as the diffusion length from the disk to the membrane is increased. It is therefore recommended to use either a magnifying glass or a microscope to visually inspect the alignment before the O-ring is placed in the groove and the cell is mounted on the interface block. When placing the O-ring, make sure it sits firmly and evenly in its groove.
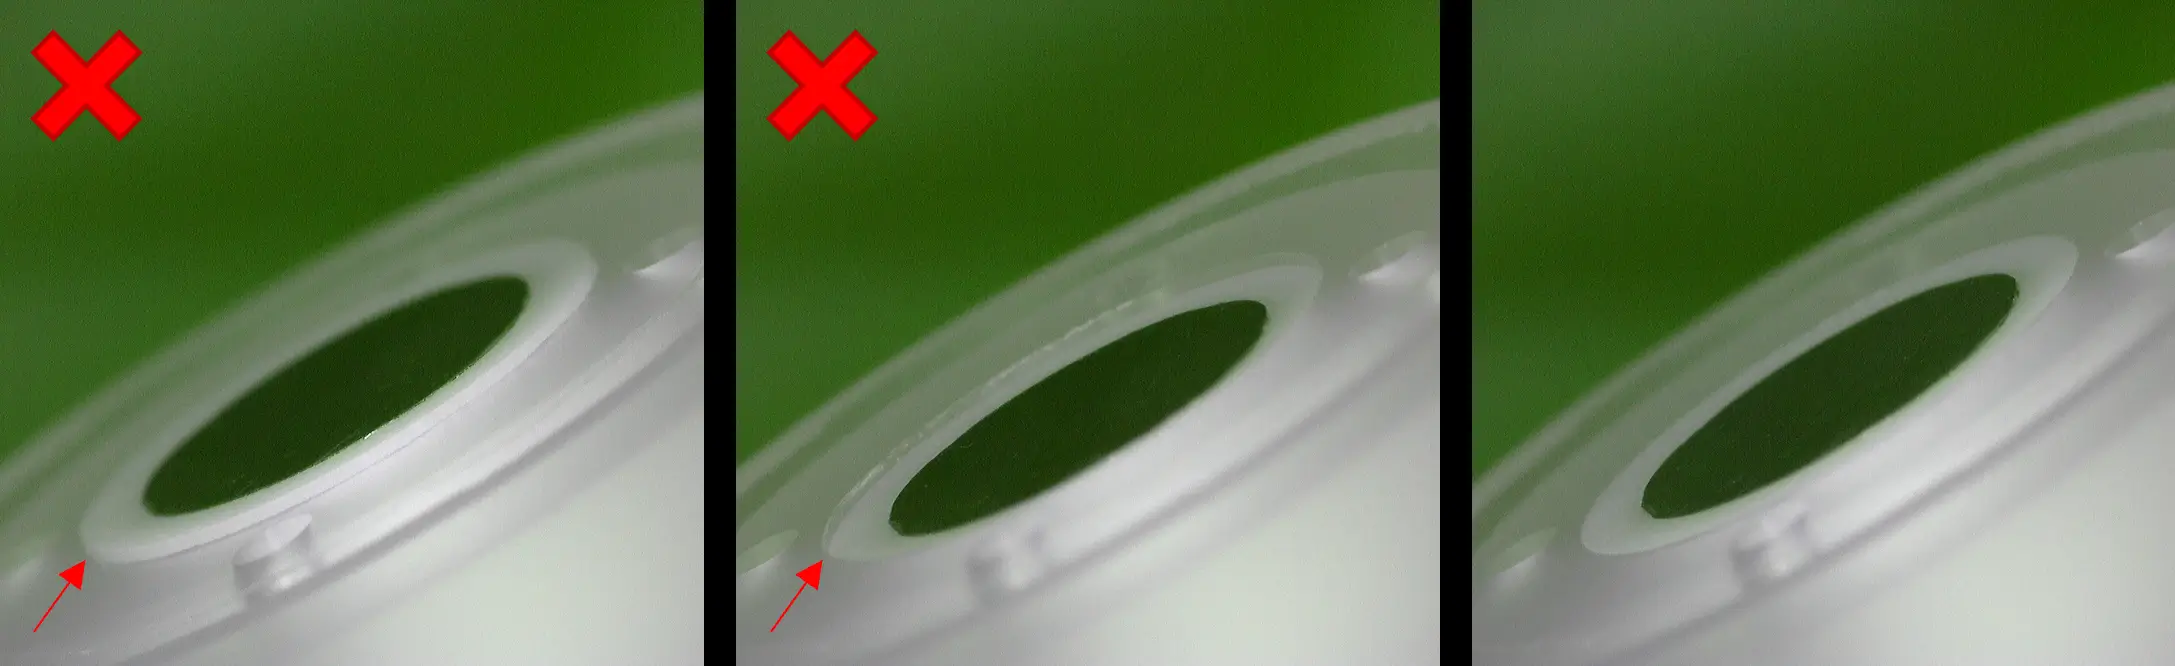
Figure 4: Correct mounting of disk and U-cup assembly in the EC-cell is important for minimizing the risk of bubbles as well as ensuring the overall performance of the EC-MS system. The surface of the disk and the U-cup should be completely flush with the cell (right). It is recommended to to use either a magnifying glass or a microscope to verify that neither the disk nor U-cup are protruding (left) or indented (middle).
Bubble formation during a measurement
Identifying the issue
Even if bubbles are avoided when mounting the cell, gas bubbles can develop during mea-surements. To make it easier to detect the presence of bubbles in the cell, it is generally recommended to monitor M28, M32 and M40. If these three masses unexpectedly increase synchronously it is a clear indication that air is entering the chip, as exemplified in Figure 5a. Such fluctuations in atmospheric signals are often followed by gas bubbles growing at the outlet of the cell, as shown in Figure 5b. Sometimes the fluctuations in the atmospheric signals can disappear without intervention (Figure 5a after 7500 s), but usually the baseline signals from air become unstable after-wards and the fluctuations tend to return shortly after. Often, some bubbles can be flushed out by injecting electrolyte, stabilizing the air signals. However, in most cases some gas bubbles will remain in the cell. Therefore, we generally recommend to remount the cell if gas bubbles are observed at any point during the measurement, bearing in mind the aforementioned mounting recommendations.
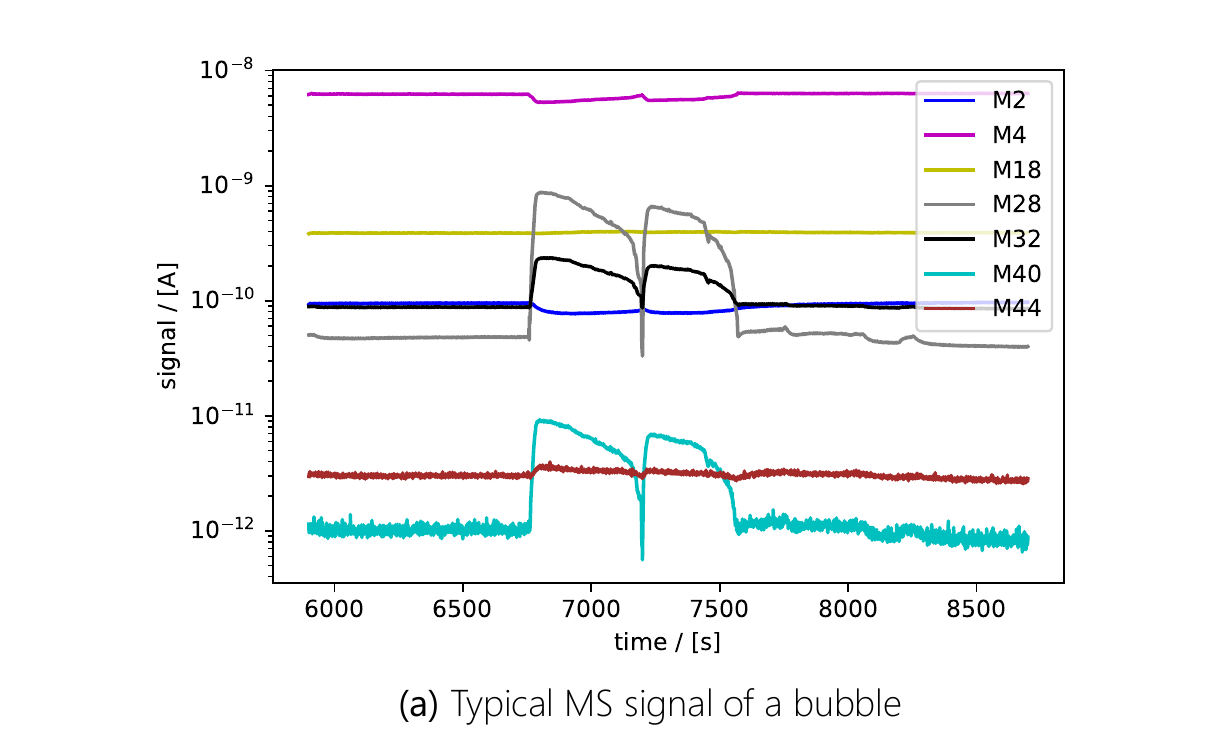
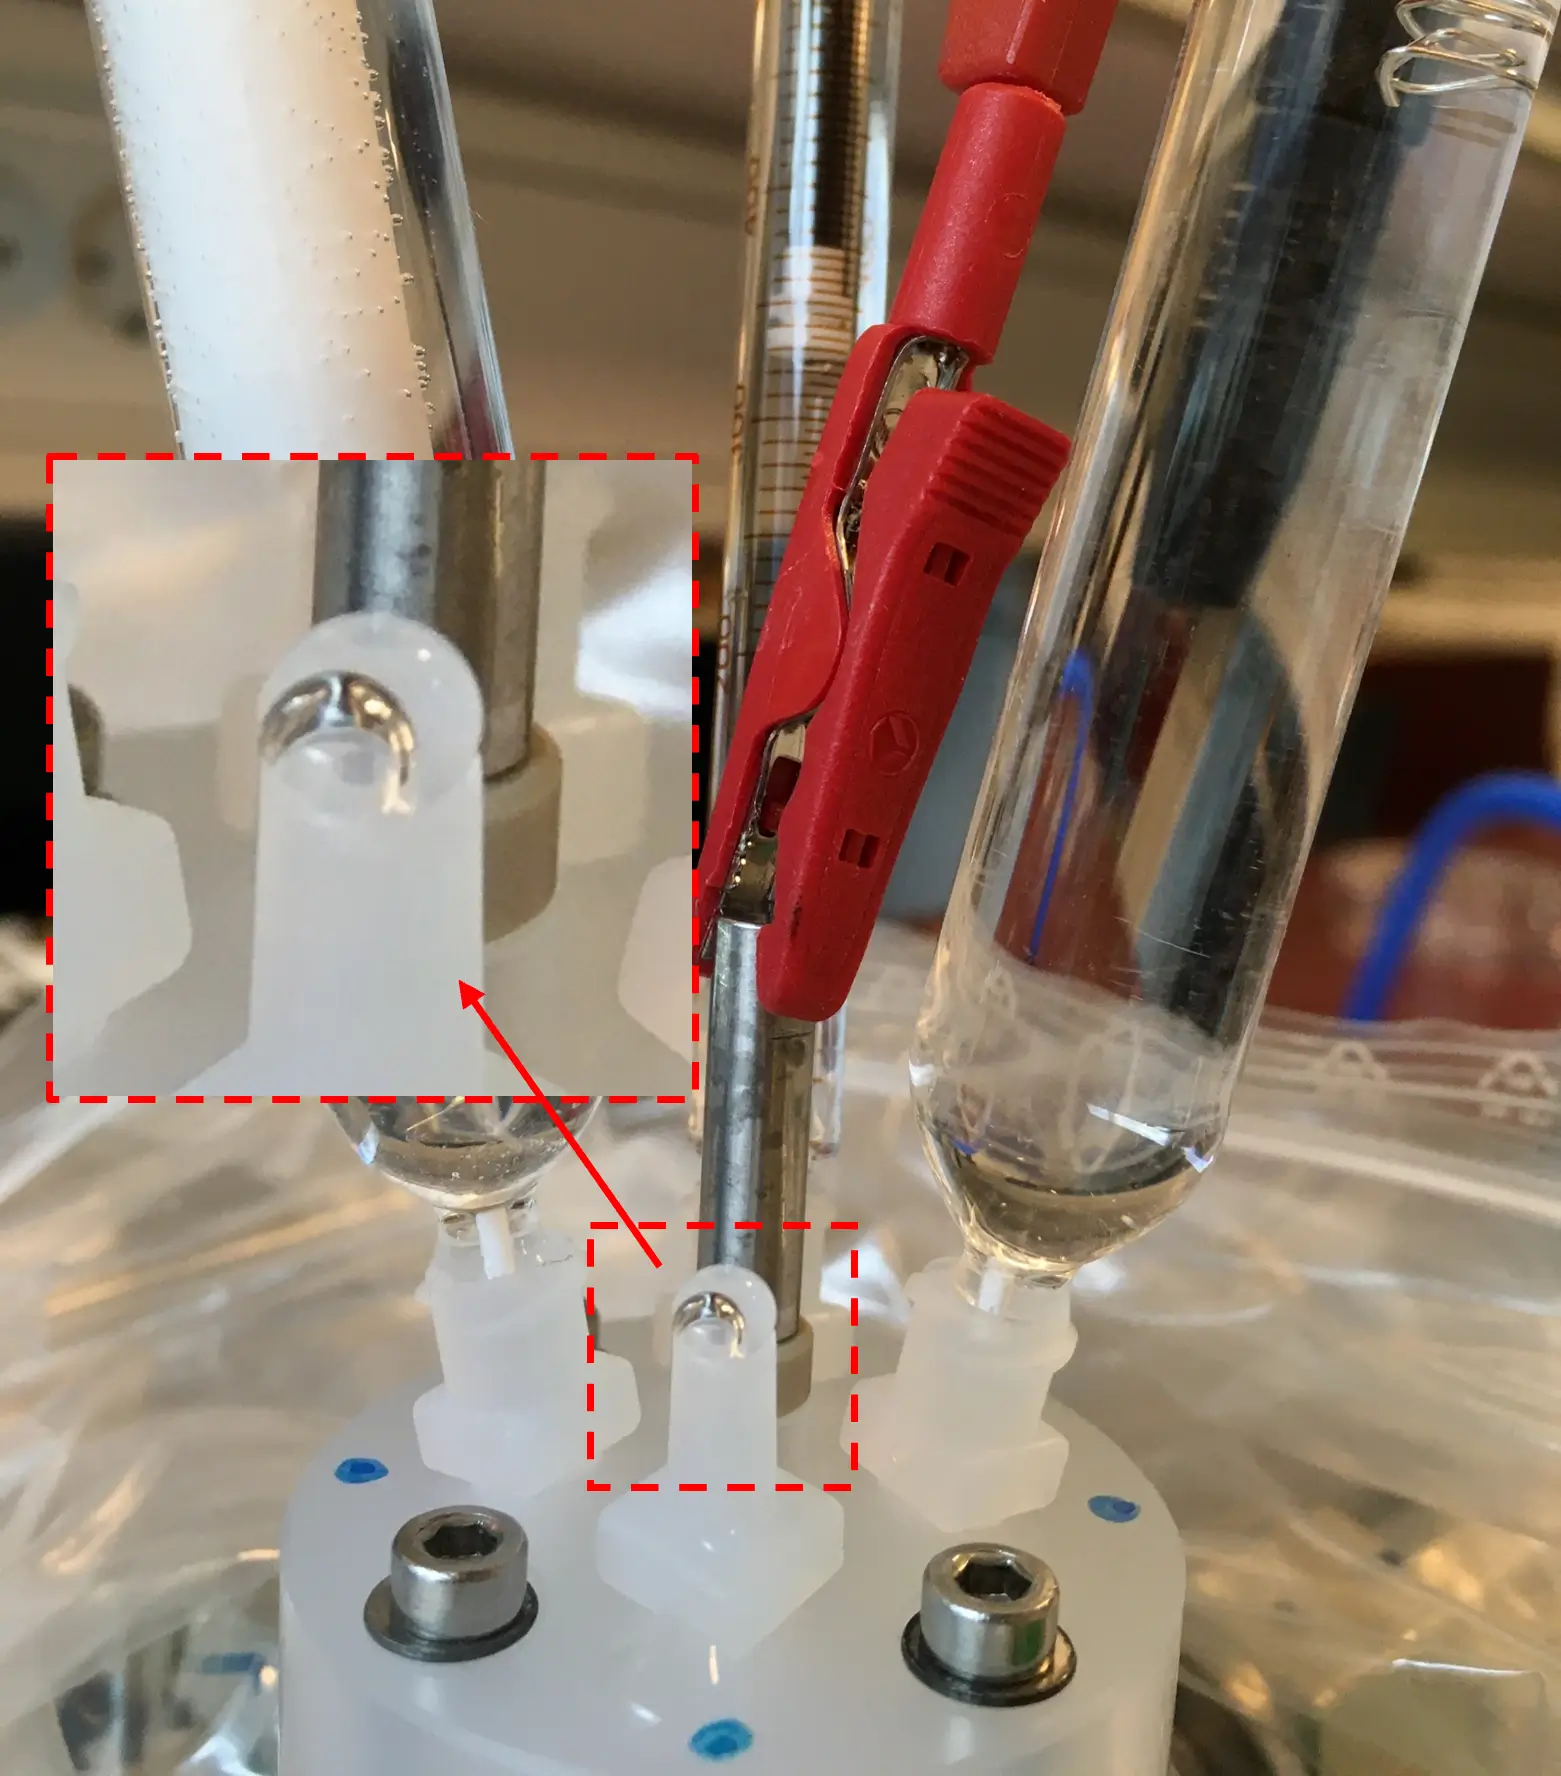
Figure 5: Indication of a air bubble observed as a synchronous increase in M28, M32 and M40 signals. Often electrical contact to the working electrode is lost at the same time, which is typically associated with sudden increase/unstable OCV or complete loss of potential control during electrochemical tests. In conjunction with this, gas bubbles sometimes emerge at the cell outlet.
Preventing bubble formation
By choosing the right operating parameters, bubble formation during measurements, can be avoided. We recommend that:
(i) Pressure set-point is set 15 mbar above the current atmospheric pressure, i.e.
PPC,set−point = Patm. + 15 mbar.
(ii) High gas evolution currents are avoided e.g. during H₂ evolution etc.
For optimal performance it is important to set the gas pressure in the chip in accordance with the current atmospheric pressure. If no gas has been passed through the chip for at least 2 h prior to starting the experiment, the atmospheric pressure can be observed from the readout of the pressure controller (PC) downstream of the chip. Alternatively, an external barometer can be used. Often, local weather services also offer pressure measurements at an hourly resolution. To avoid bubble formation, choose the PC set-point such that it is 15 mbar larger than the current atmospheric pressure. Note that for extended experiments it may be necessary to adjust the pressure over time.
Another source of bubbles can be the electrochemical experiment itself. If gaseous products form at the electrode at a rate higher than they can dissipate (diffuse through the electrolyte and be transported through the chip), bubbles can nucleate. The maximum possible current depends on the reaction, the type of experiment, transport properties of the electrolyte,
etc. For short term gas evolution, e.g. during CVs, faradaic currents up to 150-200 µA are generally tolerated at scan-rates up to 20 mV/s. Higher maximum currents are tolerated using higher scan-rates, but depend on the individual sample and conditions. In steady reactions with gas evolution, bubbles may form at lower currents. E.g. for H₂ evolution in acidic electrolyte (2e⁻ reaction), bubbles can form at currents < 50 µA.
Spikes in atmospheric signals
Identifying the issue
When operating at low over-pressure another type of phenomenon can occur seen as repeated spikes in the air-related signals M28, M32 and M40 of 1-2 s duration (Figure 6).
Preventative measures
Generally, these spikes do not affect the electrochemical measurement, i.e. if the affected masses are not required in the experiment, they can in principle be ignored. Alternatively, Ar can be used as make-up gas instead of He. As shown in Figure 6, when switching to Ar, the spikes in M28 are eliminated. Note, that Ar has mass contributions at M40, M20 (due to double ionization) and M36 as well as M38 (natural isotopes), which might conflict with the mass signals of interest.
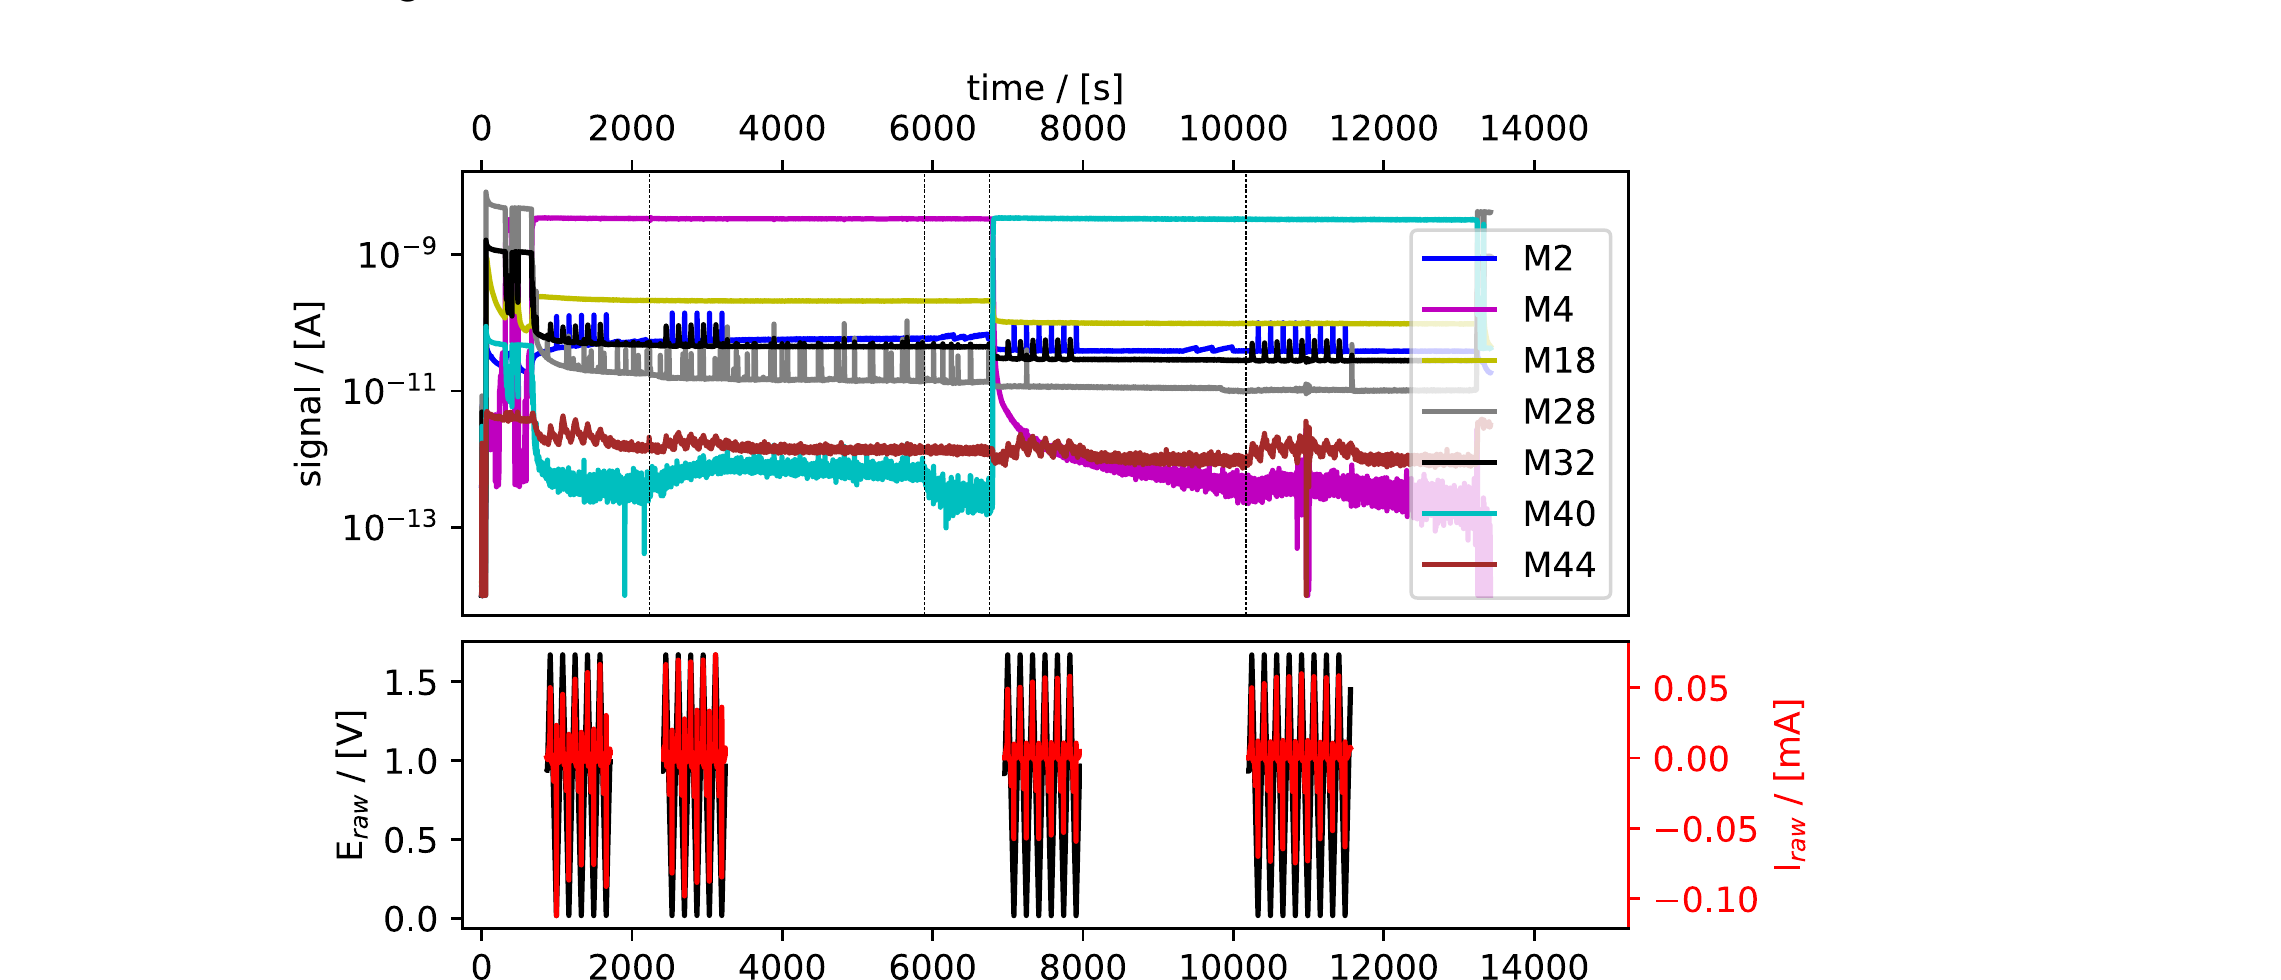
Figure 6: Air spikes often observed at low over-pressures when using He as make-up gas. The data-set shown here contains four gas switches marked with dashed vertical lines. At ∼ 2250 s, He flow is switched from MFC1 to MFC2, and then back to MFC1 at ∼ 6000 s. At ∼ 6800 s, the gas flow is switched to Ar flowed through MFC2 and from ∼ 10050 s through MFC1. At the beginning of each section, at least five CVs were recorded. The electrochemical data was not affected by the air spikes.