

EC‐MS Technical Note #5
Non-aqueous chip performance
EC-MS Technical notes #5
- Last updated

Introduction
Regular tuning of the mass spectrometer ensures reproducible data. There are two pa‐ rameters that need to be tuned: peak shape and position, and the electron multiplier (EM) voltage if using the secondary electron multiplier (SEM) detector. Both is done in Pfeiffer Vacuum’s software PV MassSpec. Additional information on tuning here can be found in the EC‐MS user manual. This technical note gives step‐by‐step instructions for tuning, as well as showing typical examples of MID and mass spectra recorded on a well‐tuned system under standard con‐ ditions, as a reference.
Peak tuning
Tuning of peak position and width is crucial to obtain reliable sensitivity when collecting MID data using the EC-MS. Zilien collects the signal intensity precisely at the chosen mass. Therefore, already a slight shift in peak position can potentially lead to a large difference in signal intensity, if a position on the side of the peak is probed instead of the maximum.
In this example, we will tune only with the masses available in air and with He carrier gas, i.e. M4, M28 and M40. Upon delivery of your instrument it will be pre-tuned using a calibration gas containing He (M4), N<sub>2</sub> (M28), Ar (M40) and Xe (M129). Note that it is necessary to always tune over the entire mass range of interest to get the best possible results. I.e. if some products have mass fragments above M40, we recommend also tuning a higher mass between 100-200 amu. While it is easy and reliable, it is not a necessity to use a calibration gas containing Xe; it is also possible to use e.g.: a volatile substance with known mass fragment at a higher mass. In this case, use a non-aqueous chip or a dilute aqueous solution to prevent chip breach.
For more information on different tuning procedures the user is referred to the PV MassSpec Manual (accessible via the “Help” tab in the software), in particular the section “Best Known Methods for Tuning” and related topics.
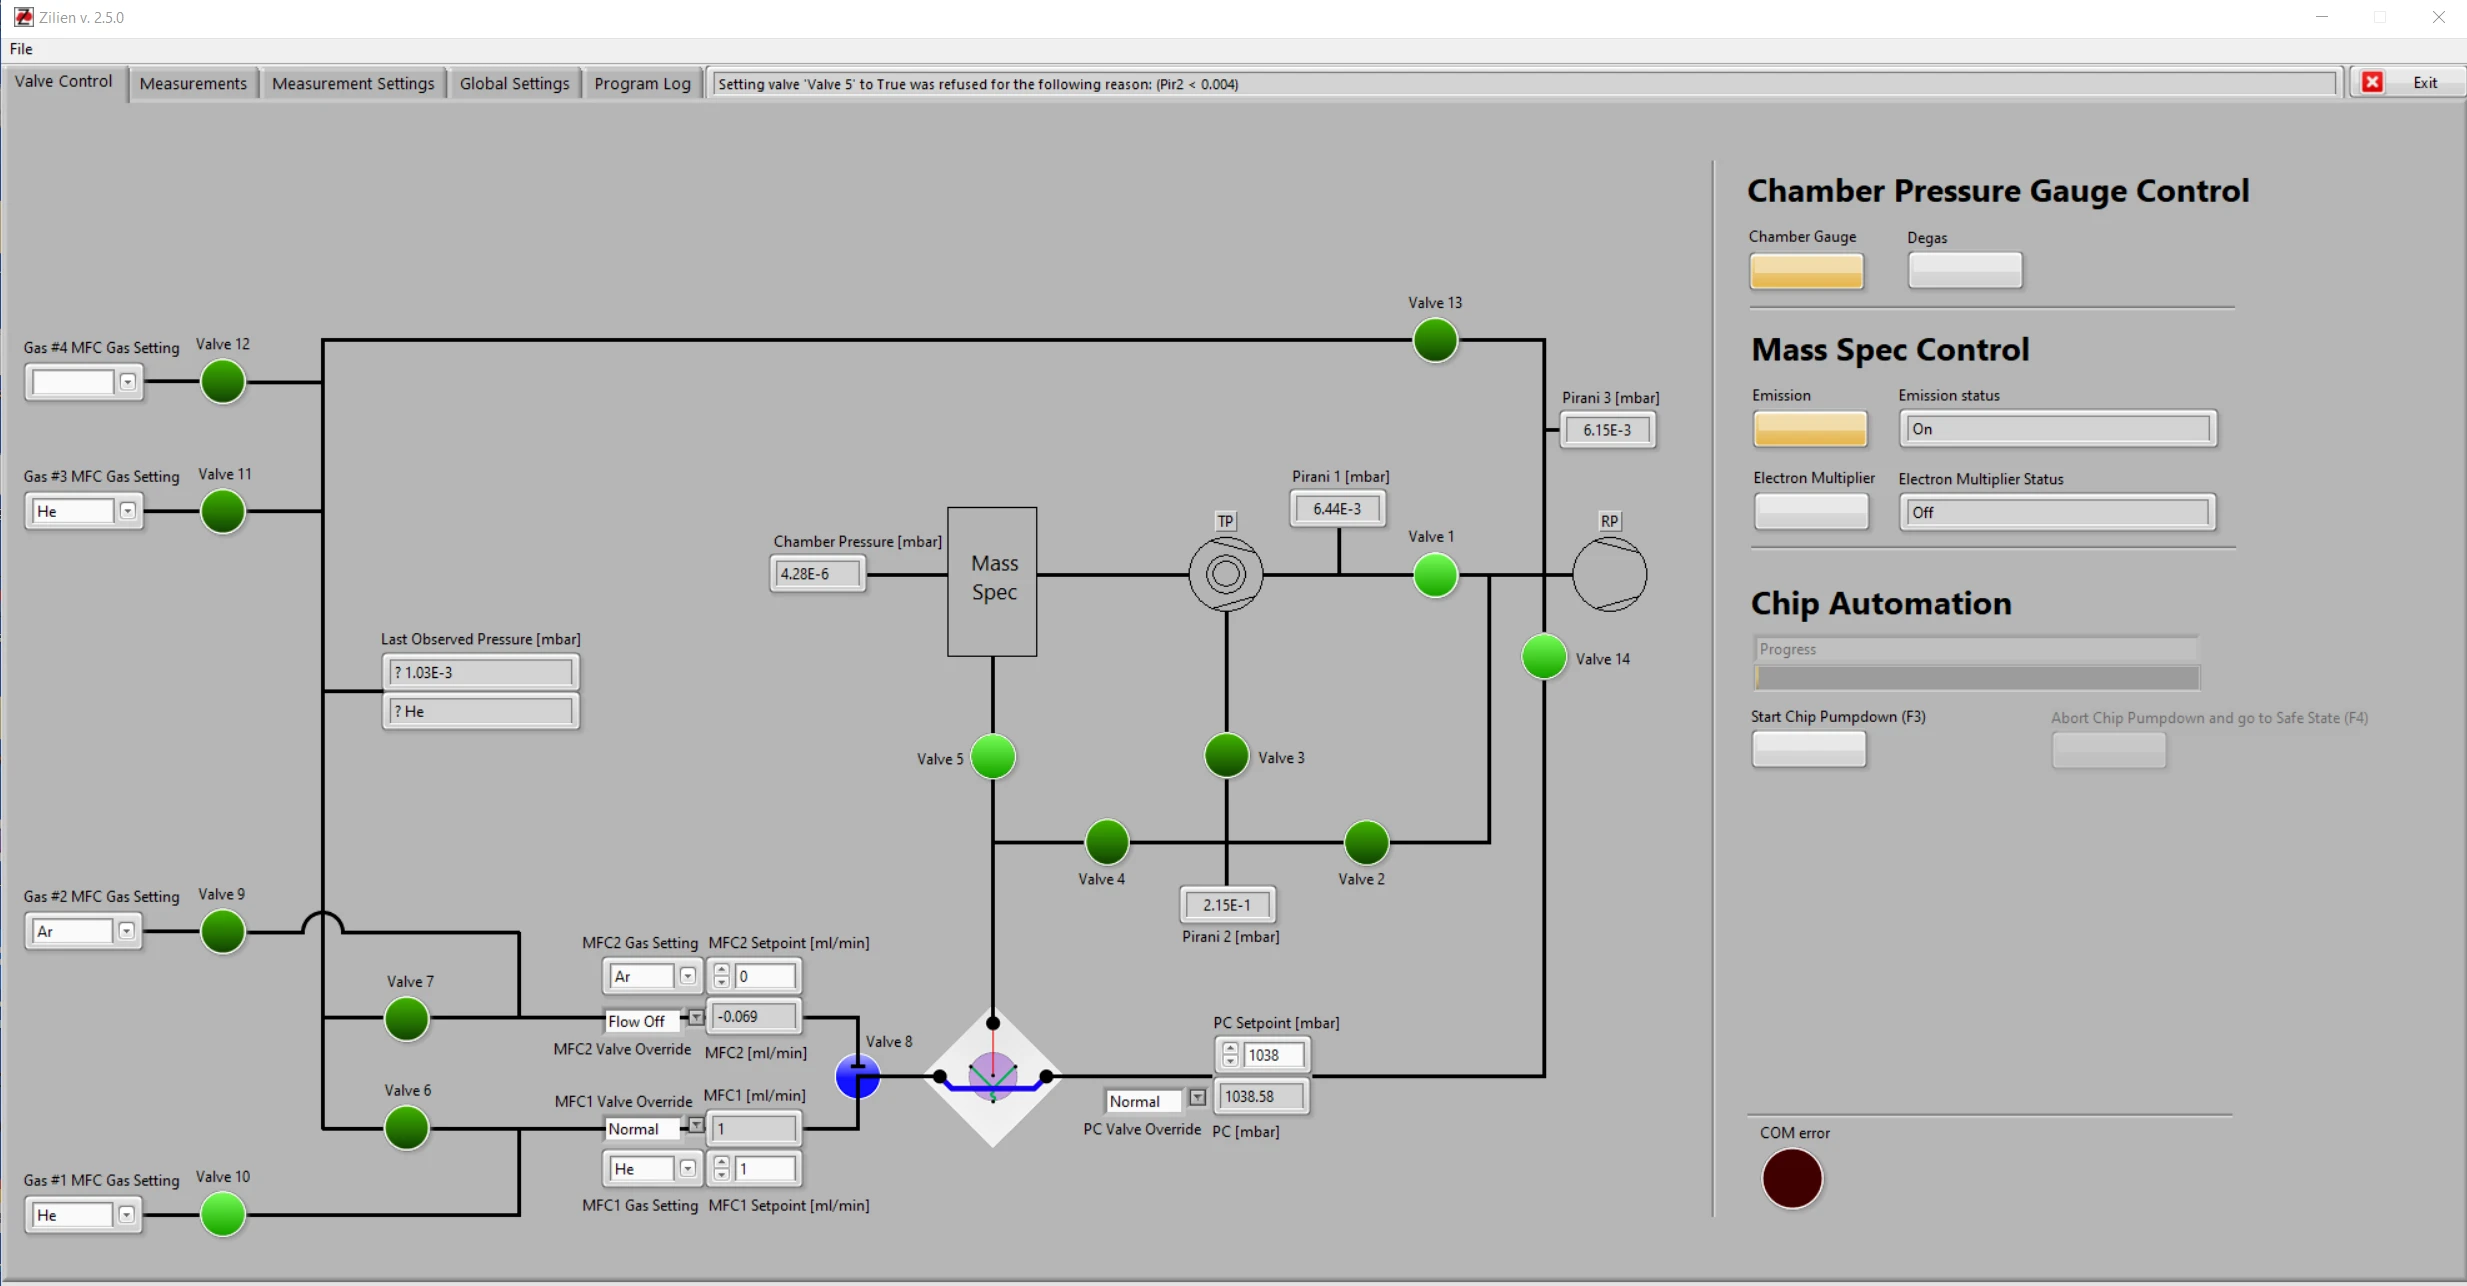
Figure 1 caption: Zilien status for tuning.

(a) System status window
(b) Tuning tab, zoom-in on settings
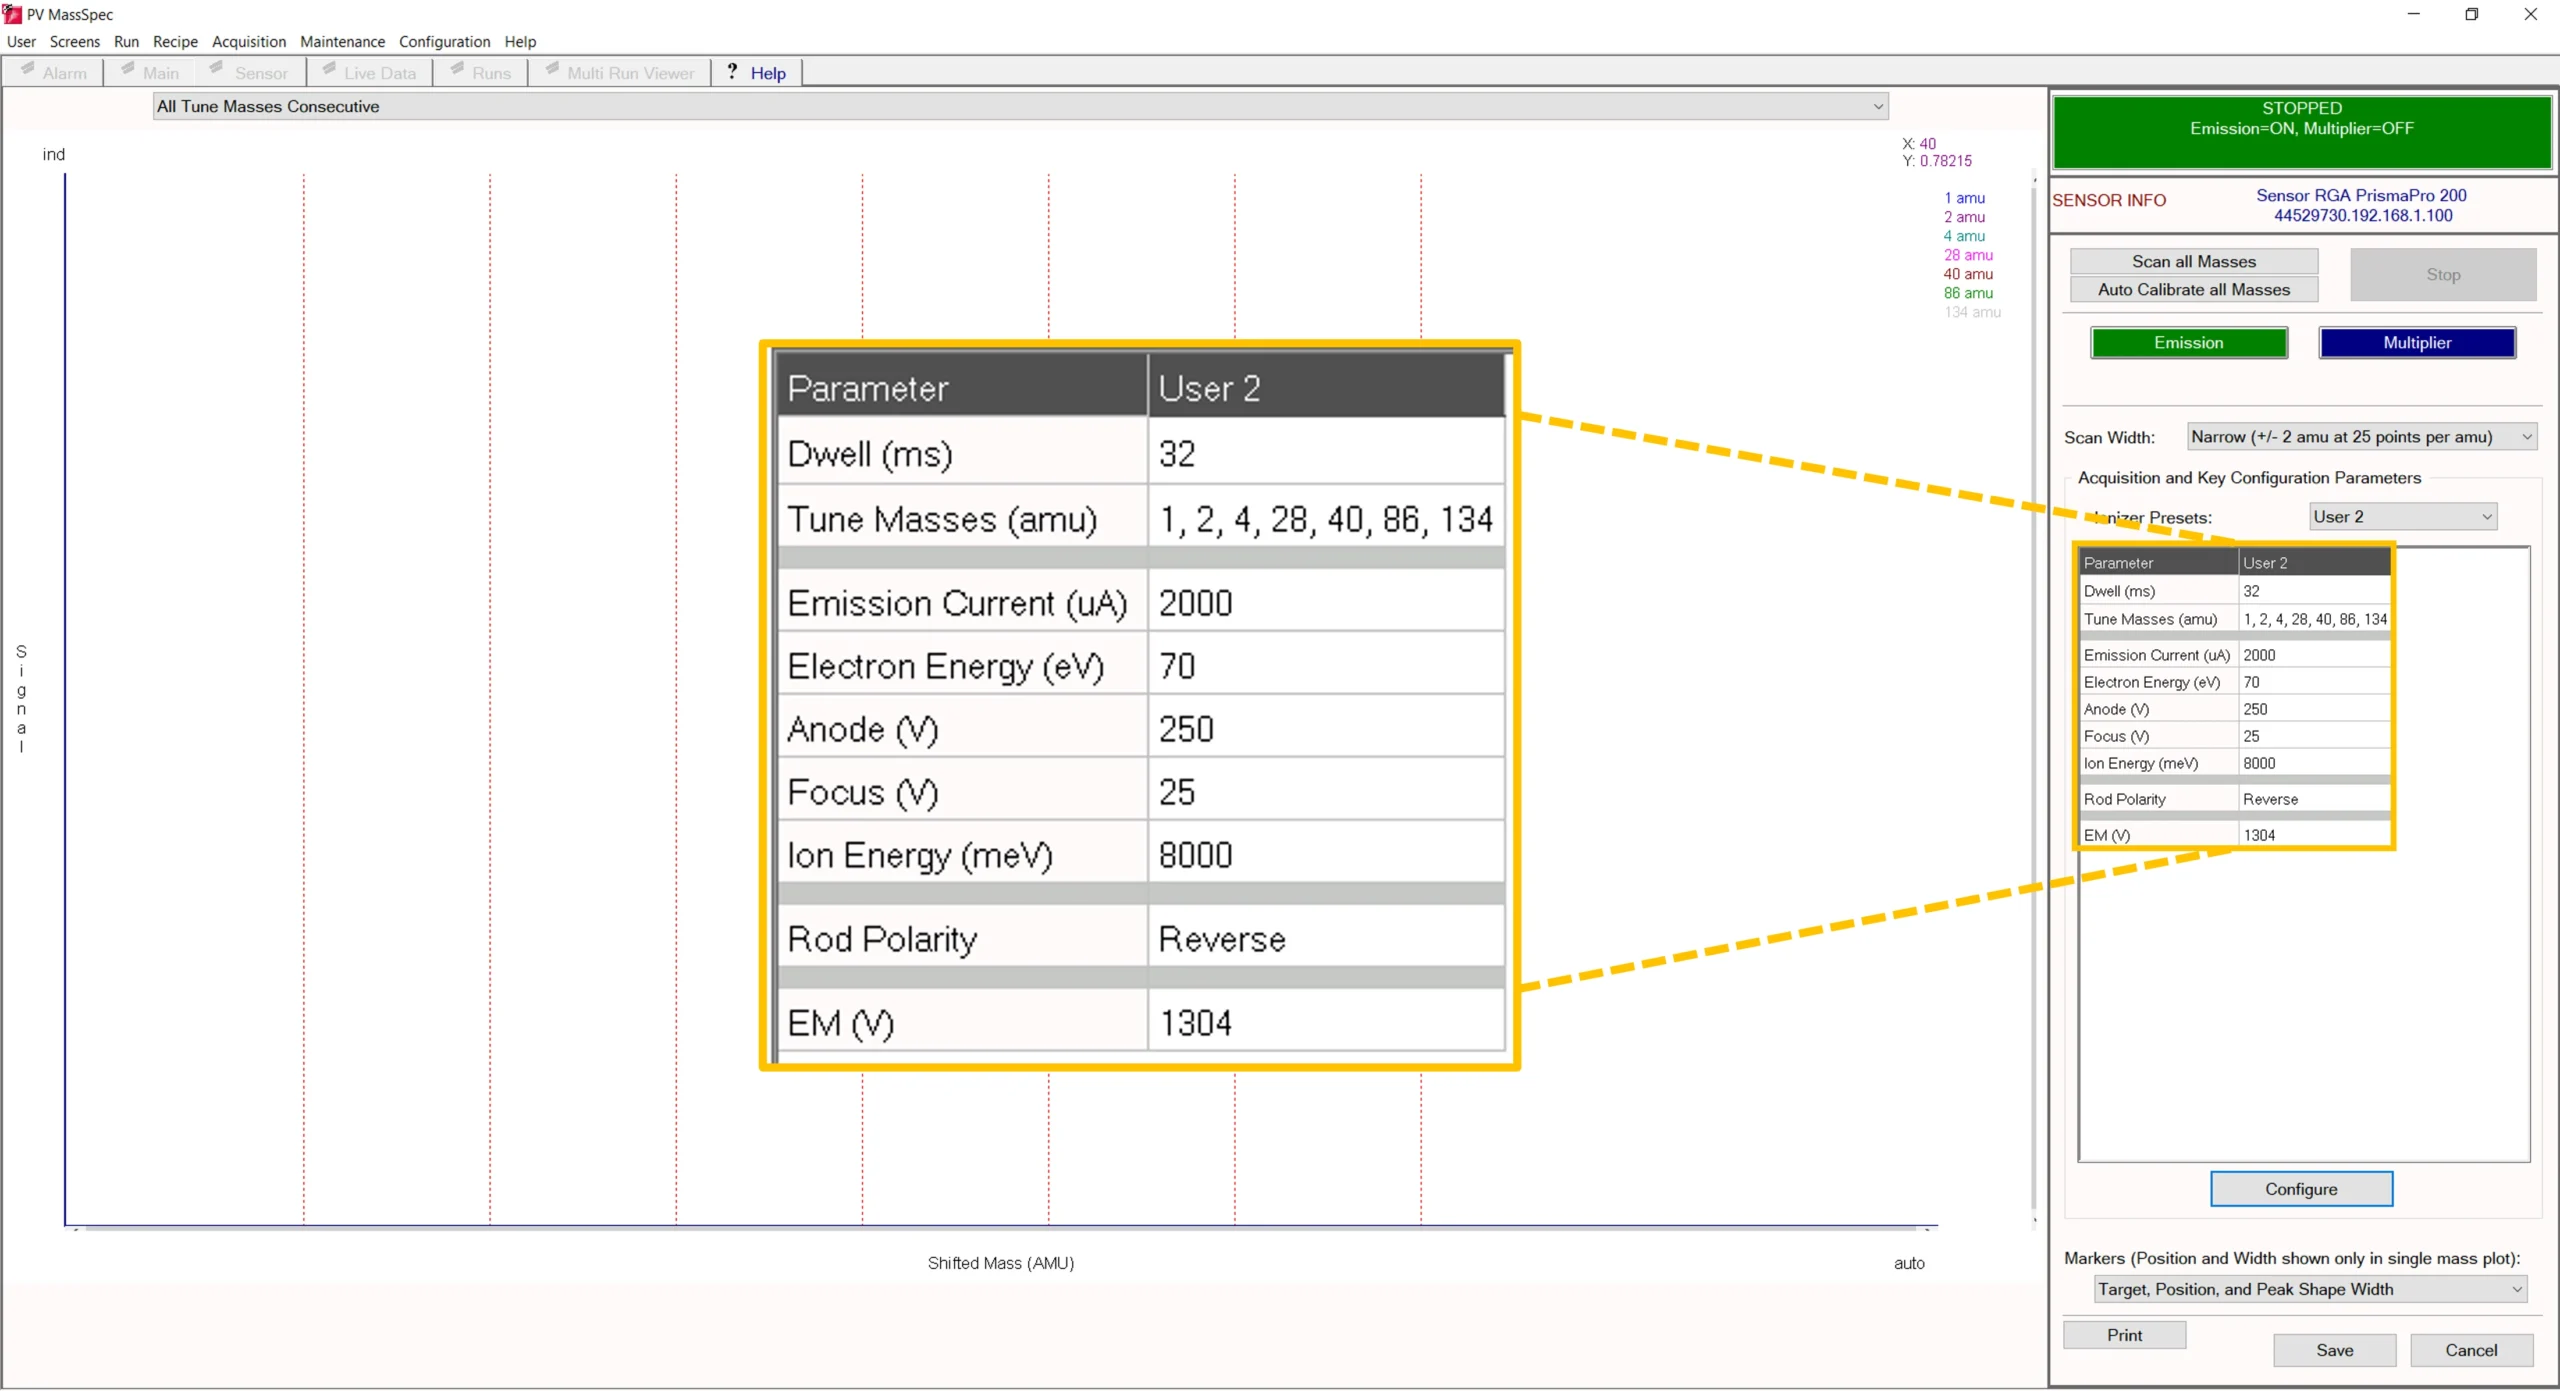
Figure 2 caption: PV MassSpec “Tune” tab.
- Before doing a calibration, make sure emission has been turned on for at least 1h to allow the sensor to warm up.
- Open Zilien, pump down the chip and open valve 5. Start He flow (1mL/min). See figure 1.
- Close Zilien (make sure that no measurement is running).
- Open PV MassSpec
- In the “system status” tab, click on “tune” to open the tune tab (see figure 2a, yellow circle).
- For standard operation we recommend the settings shown in figure 2b. If you would like to change the MS parameters or add/remove masses to be tuned, you can do so by clicking “configure” and then scrolling down to reach the relevant settings. It is not necessary to remove masses from the list even if you don’t intend to use them for tuning.
Warning: Do not tune masses 1 and 2 unless you have H2 gas available, but do not delete the masses from the list of tuning parameters.
Warning: Do not change the electron energy without changing other ionization parameters first. Read Technical Note #7 – Soft Ionisation for instructions on how to do so safely. Damage to the instrument as a result of ionization parameter manipulation is at own risk.
- Now put a drop of water on the chip such that the entire membrane area is covered and select “tune mass 4” in the drop-down menu.
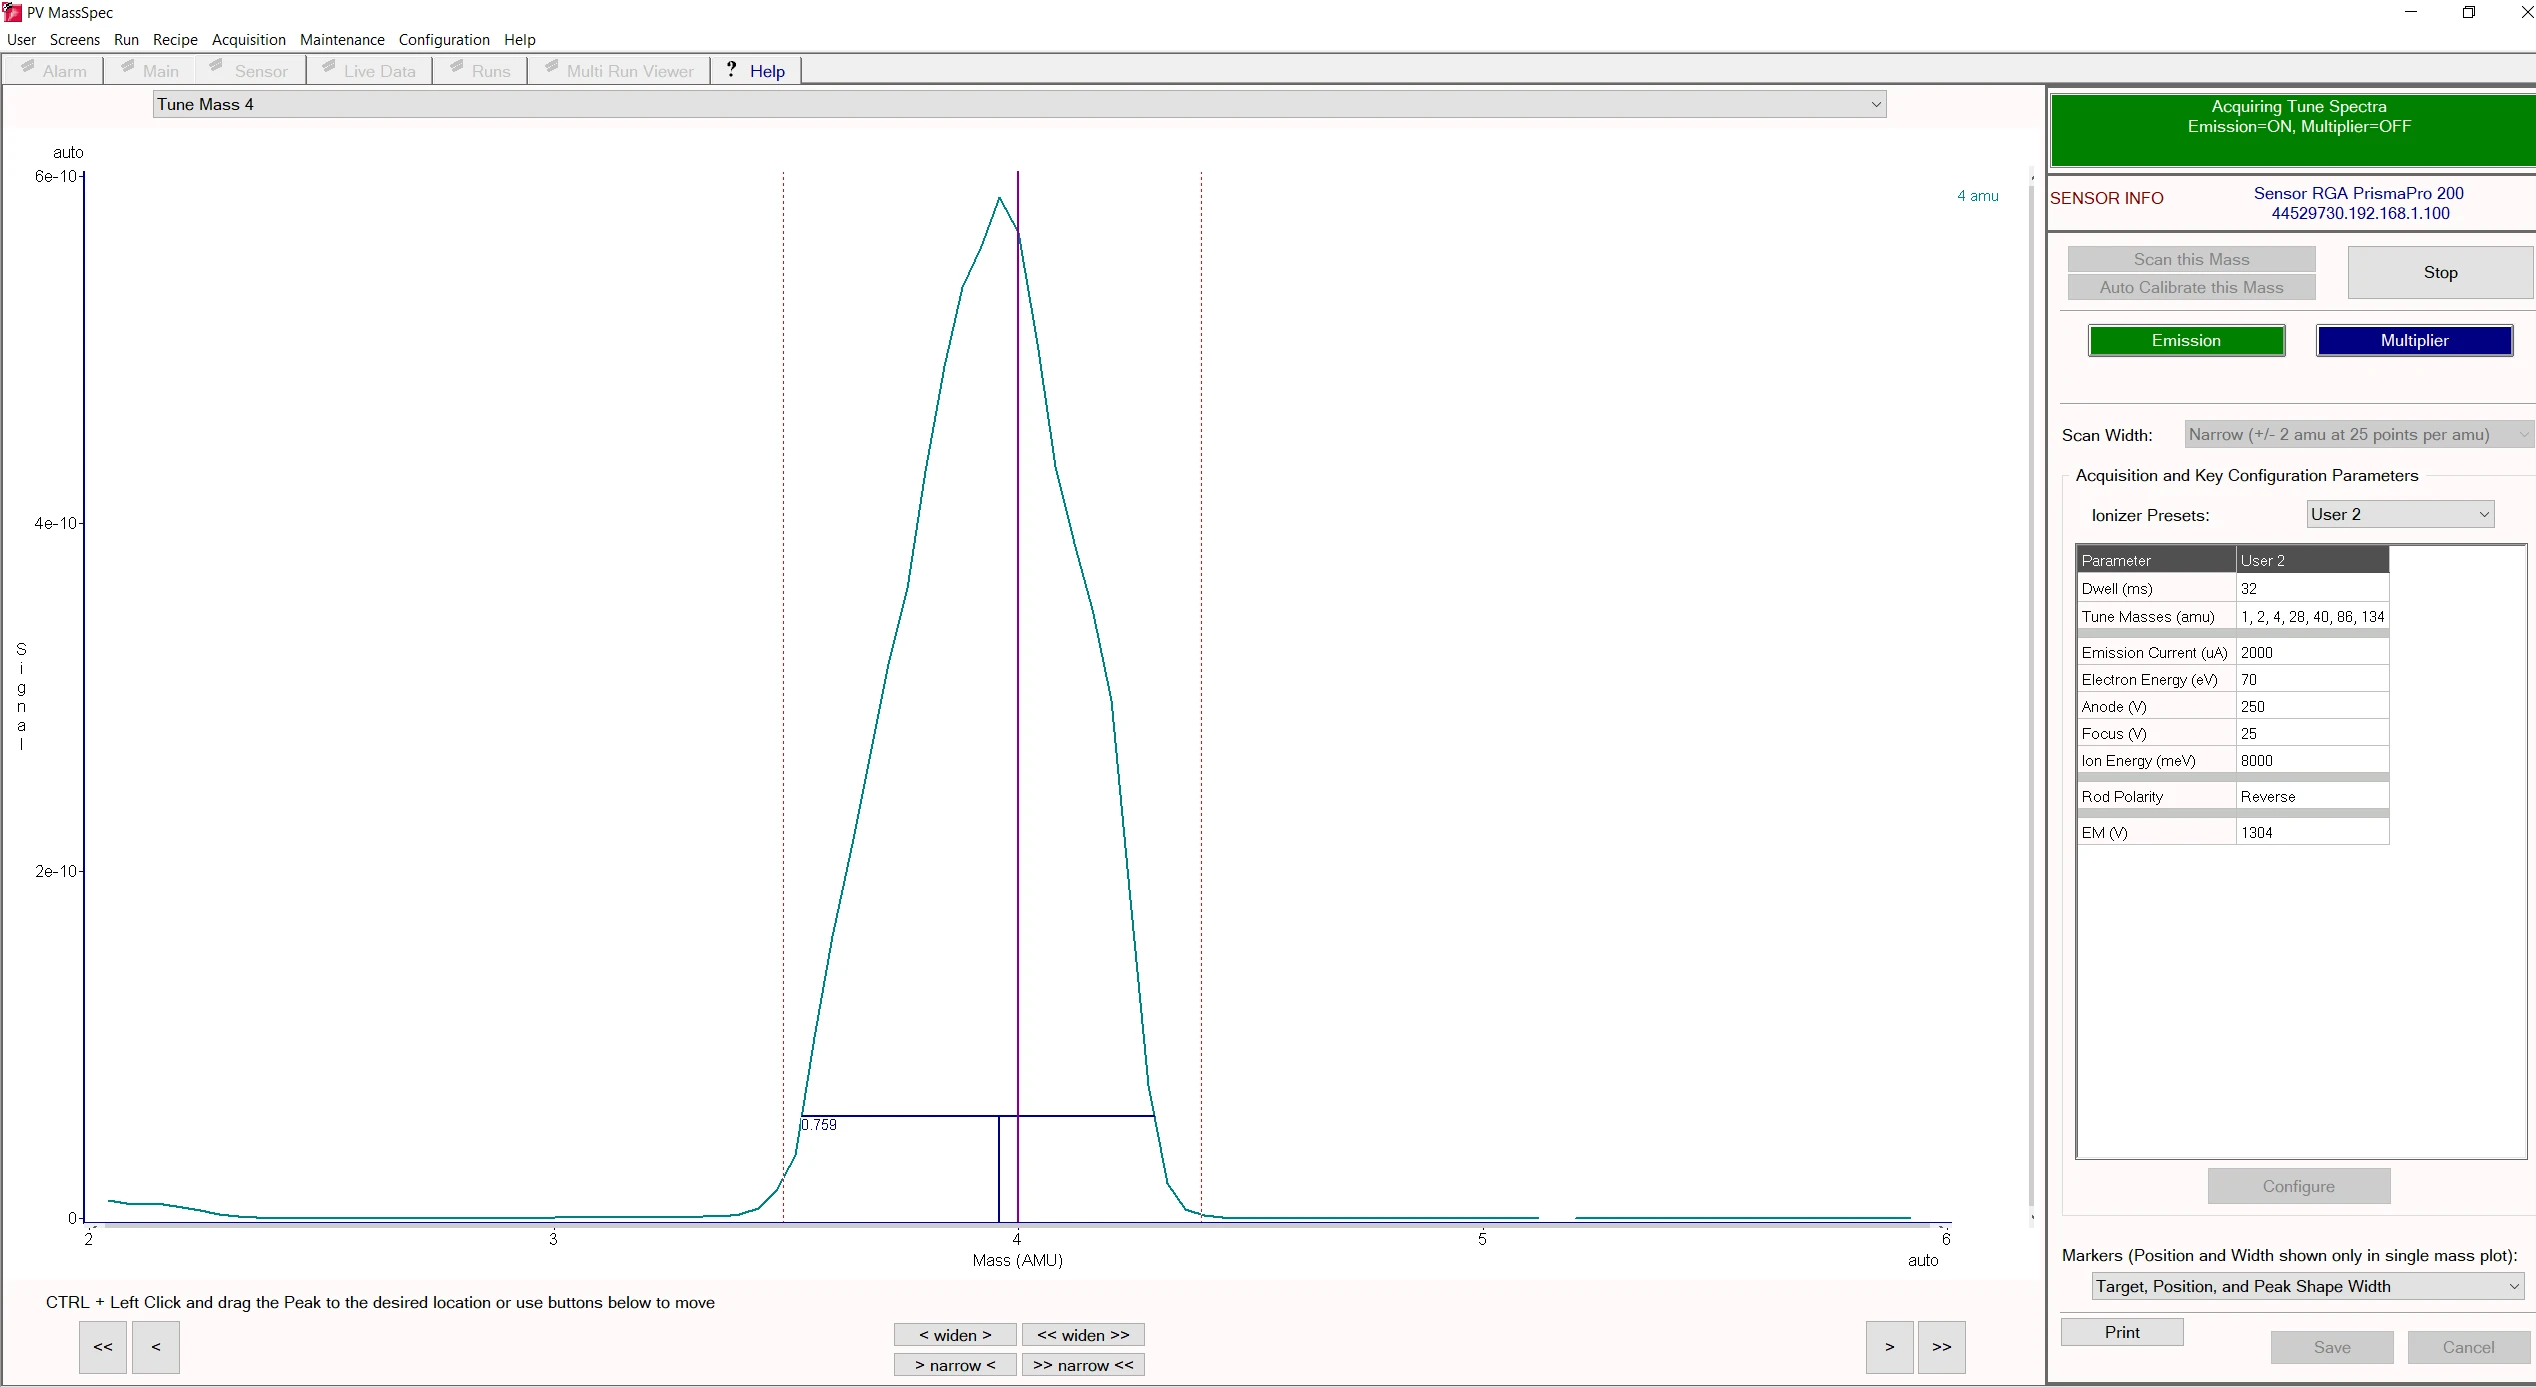
- Click “scan this mass” on the grey button on the right. The MS will start scanning over the selected mass range and a peak will appear around +/-2 amu around mass 4, see figure 3a. If the tuning is very far off (i.e. the M4 fragment is out of the narrow range) pre-tuning with “wide” scan width is recommended (selected in drop-down on the right).
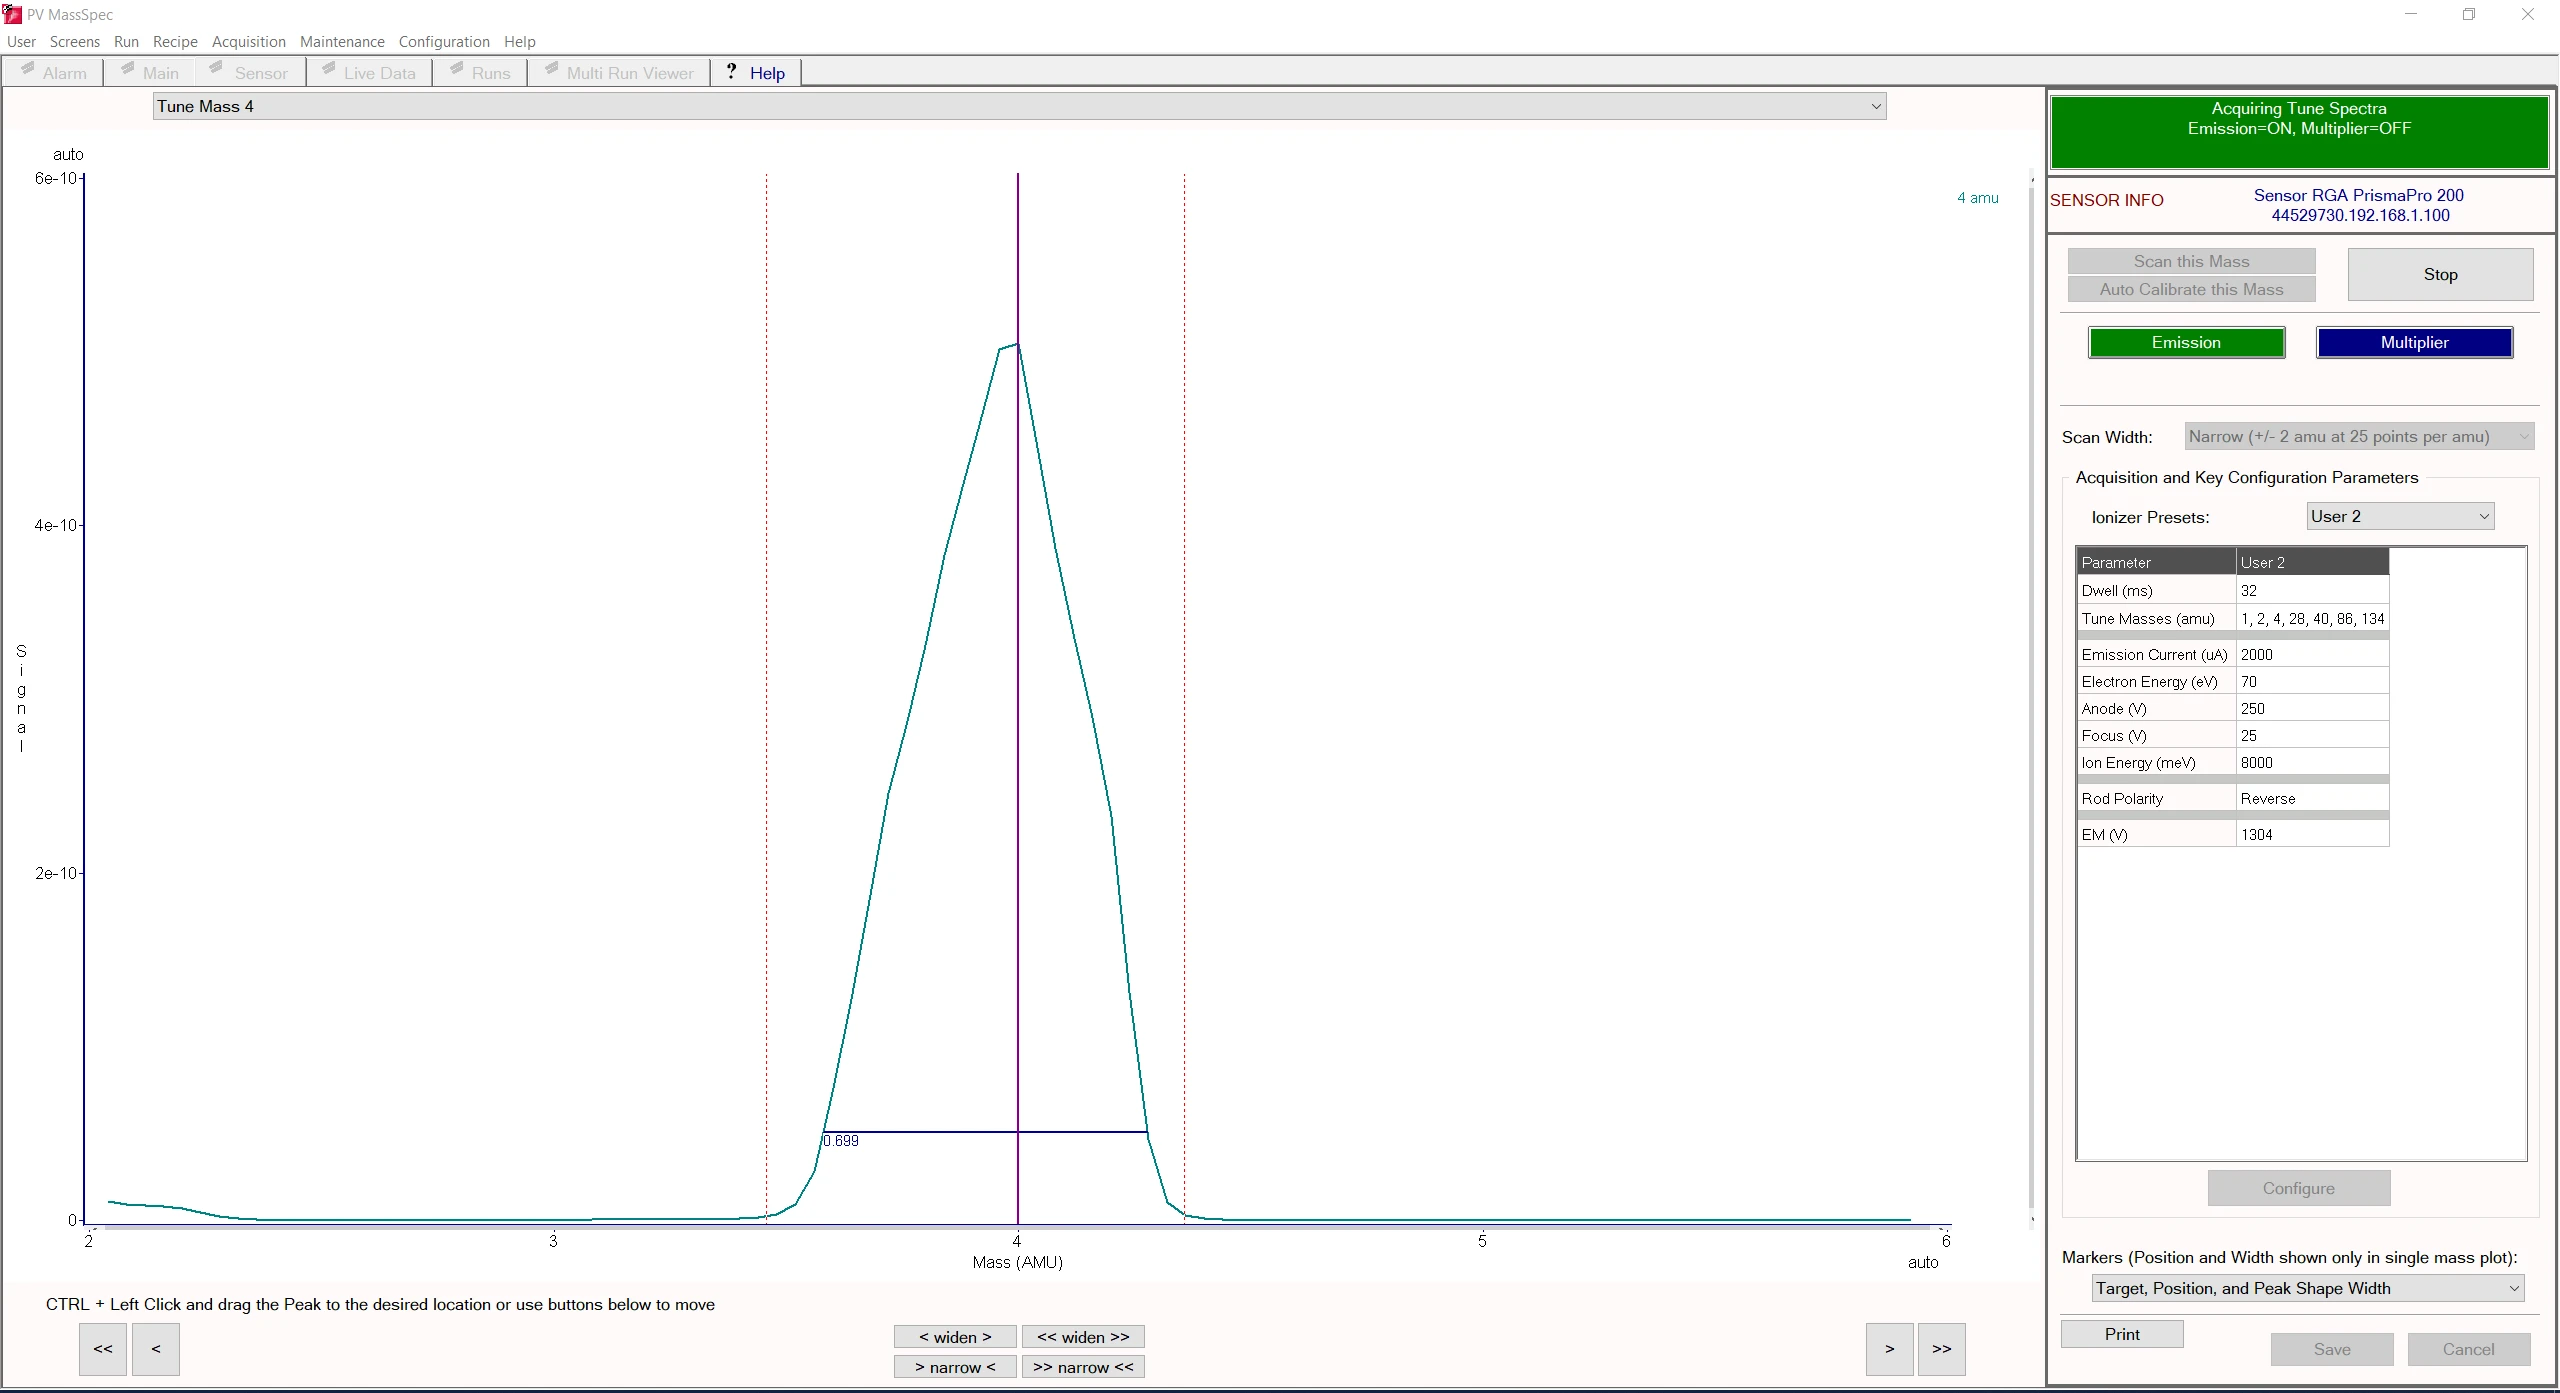
- Use the buttons “widen” and “narrow” below the mass spectrum to adjust peak width. We recommend a width of 0.7 amu at 10% peak height for best mass resolution. When using the SEM, signal stability over time has been observed to be better at lower mass resolution, e.g. a peak width of 0.9-1 amu at 10% peak height.
- Adjust peak position with the arrow buttons on the very left and very right below the mass spectrum or by pressing CTRL+Left mouse button and dragging the peak to the center line.
- Iterate between adjusting both peak width and position until you obtain a stable peak with a clear maximum at the position of the center line and with the desired width. Note that the peak will usually not be entirely symmetric (see figure 3b).
- Remove the water drop from the chip and proceed in the same way for M40 (Ar) and finally M28 (N2) from air. Generally, tuning in the order of lowest mass, highest mass, and finally mass(es) in between is recommended for best results.
- Finally press “save” to exit the tuning window.
- Now close PV MassSpec, open Zilien again and proceed with your measurement.
(a) Before tuning
(b) After tuning
Figure 3: Mass 4 tuning: notice how the position and width of peak changed.
If you have to make substantial changes for one or more of the masses, go back to the previously tuned masses and check the other masses again if you need to re-adjust.
If you want to tune using a calibration gas, flow this gas through the chip instead of He. If you have several calibration gasses that you need to switch between, you will need to close PV MassSpec in between, change gas using Zilien, close Zilien again and re-open PV MassSpec for every gas switch.
Figure 4 shows the typical signal intensities for a selection of masses common for aqueous electrochemical experiments during a drop-test as measured with the Faraday cup detector. At ca. 260 s experiment time, a drop of ultra-pure water was placed on the chip, covering the entire membrane area. This results in the signal from the make-up gas to increase and the contributions from air to drop. Note that the observed signal intensity as measured with the Faraday cup depends on the size of the chip’s capillary and can therefore vary slightly from chip to chip.
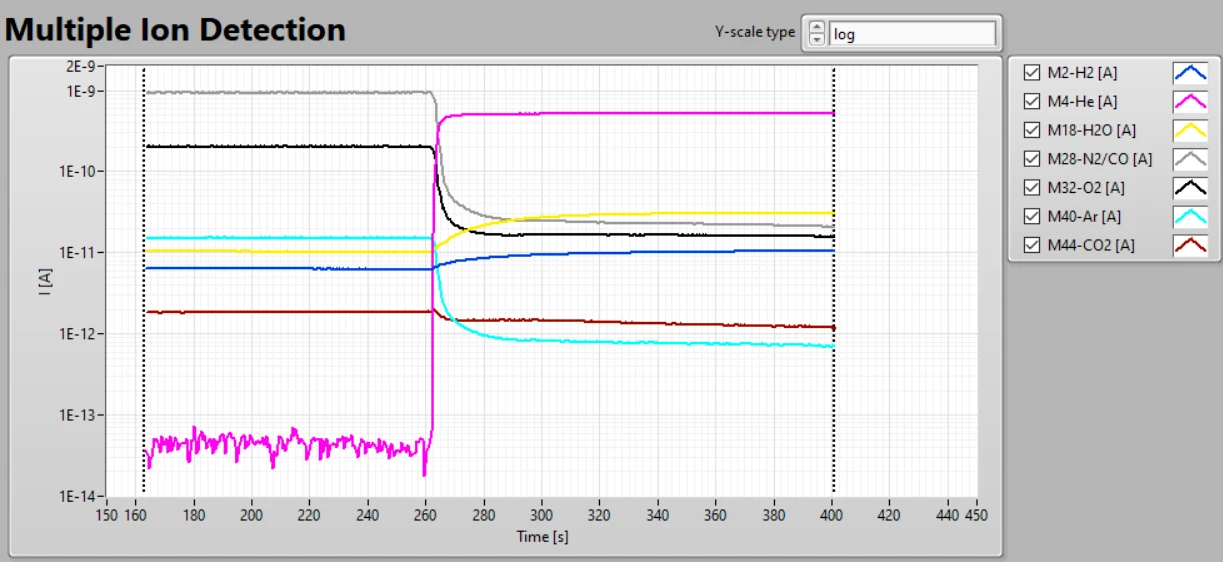
Figure 4 caption: Signal response observed during a drop test as measured by the Faraday cup (SEM turned off).
EM tuning
Electron multiplier detectors degrade over time. To maintain constant signal intensity, the detector voltage needs to be adjusted (usually increased) over time. In the EC-MS, using the multiplier, signal intensity can be increased by ca. a factor 100, compared to the signal intensity of the Faraday cup. This is achievable with a voltage around 1000 V. When the EM voltage needs to be increased to 1500 V, the user should consider replacing the EM. Note that with the recommended settings, the EM voltage will decrease fairly quickly, requiring multiple calibration points when quantification is desired. See the EC-MS Application note #2 – Quantification for details.
We recommend adjusting the signal intensity for a target signal of 1e-07 A for the highest expected signal. We use the M28 signal intensity measured on a chip open to air as the reference signal for tuning, as outlined below.
- The multiplier has to be turned on for at least 24h before the tuning in order to achieve reliable results.
- Open Zilien, pump down the chip and open valve 5.
- Close Zilien (make sure that no measurement is running).
- Open PV MassSpec.
- In the system status menu in PV MassSpec, choose “Sensor maintenance” (see figure 2a in purple) and select “Calibrate Sensitivity and/or EM voltage” from the drop-down menu.
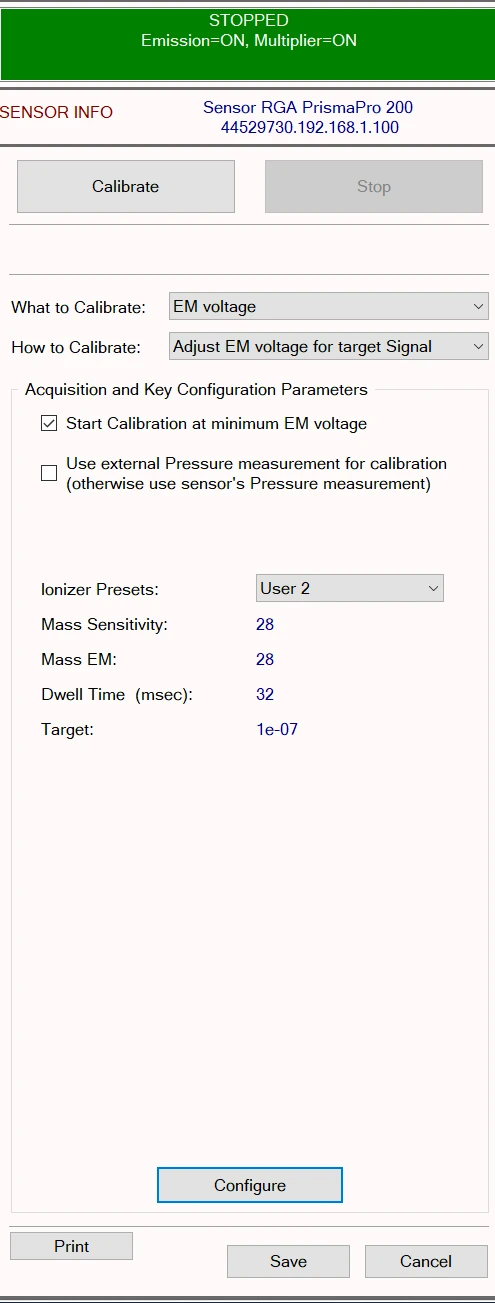
Figure 5 caption: EM tuning
- Set the parameters shown in figure 5 by selecting the right settings from the drop-down menu or in the pop-up window accessible by clicking “Configure”, respectively.
- When the right settings are chosen, press “Calibrate” on the top of the right panel.
- The multiplier will automatically ramp the voltage from 0 until reaching the target current and then save that as the new EM voltage. The resulting gain should be around 100. If the target current cannot be reached, double check in Zilien whether V5 is open.
- Finally press “Save” to exit the sensor calibration window.
- Close PV MassSpec, open Zilien and proceed with your measurement
Figure 6 shows the typical signal intensities for a selection of masses common for aqueous electrochemical experiments during a drop-test as measured with a freshly tuned SEM detector. The break between 25-120 s is due to a mass spectrum being recorded in that time period. At ca. 200 s experiment time, a drop of ultra-pure water was placed on the chip, covering the entire membrane area. As before, this results in the signal from the make-up gas to increase and the contributions from air to drop. While the signal intensity measured by the SEM depends on the same factors as the Faraday cup (such as individual chip capillary size), but is primarily affected by the tuning state of the detector.
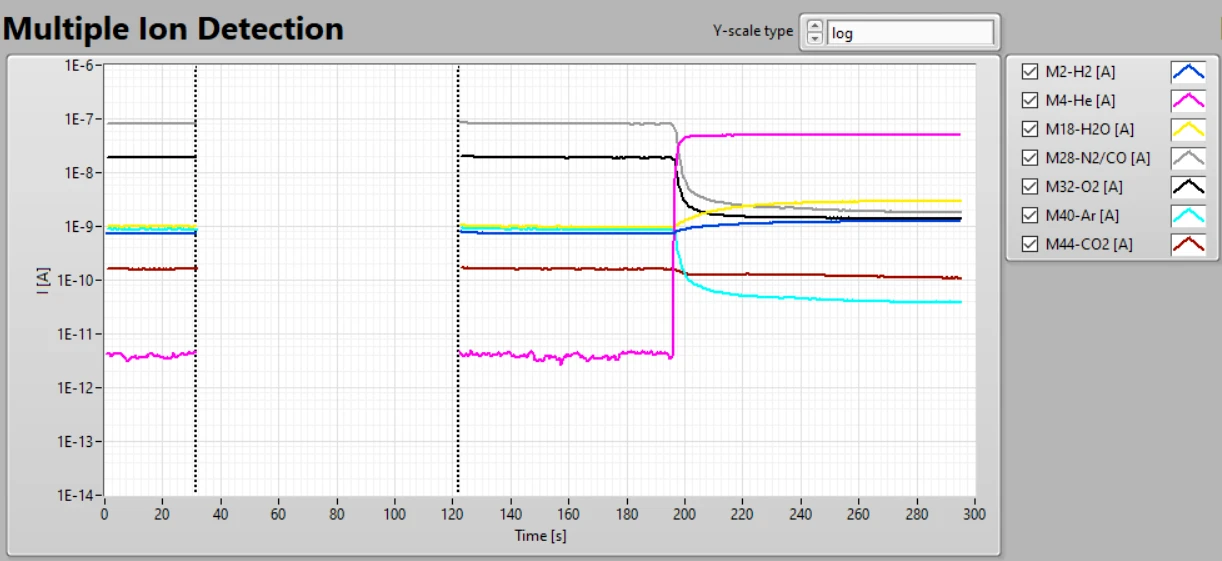
Figure 6 caption: Signal response observed during a drop test as measured using the SEM directly after tuning.
Figure 6 shows the typical signal intensities for a selection of masses common for aqueous electrochemical experiments during a drop-test as measured with a freshly tuned SEM detector. The break between 25-120 s is due to a mass spectrum being recorded in that time period. At ca. 200 s experiment time, a drop of ultra-pure water was placed on the chip, covering the entire membrane area. As before, this results in the signal from the make-up gas to increase and the contributions from air to drop. While the signal intensity measured by the SEM depends on the same factors as the Faraday cup (such as individual chip capillary size), but is primarily affected by the tuning state of the detector.
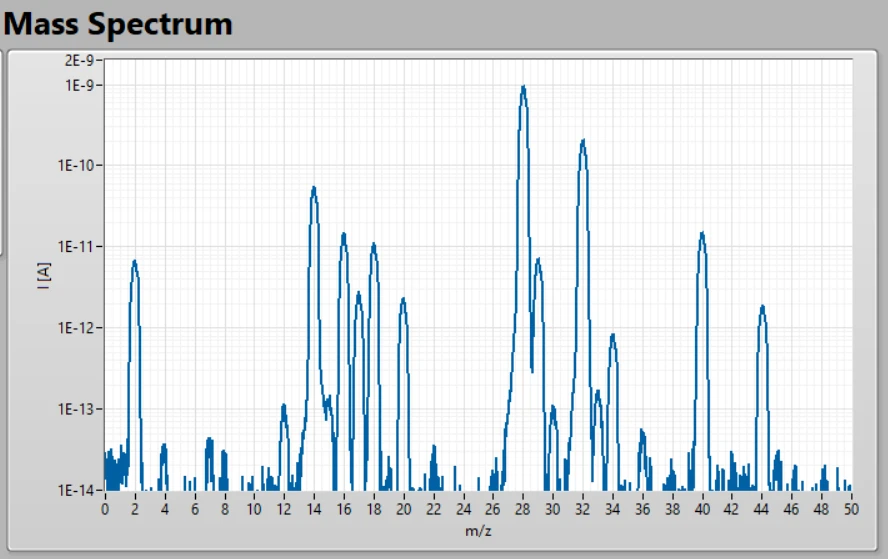
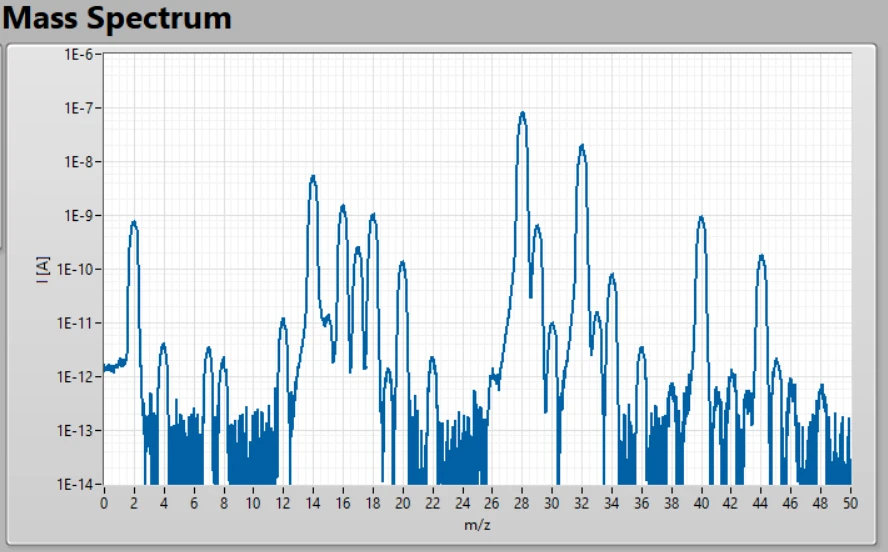
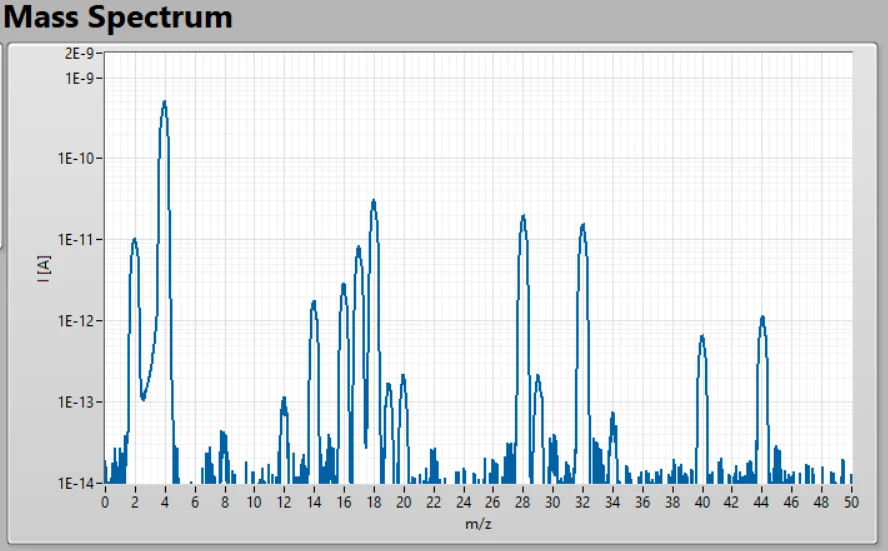
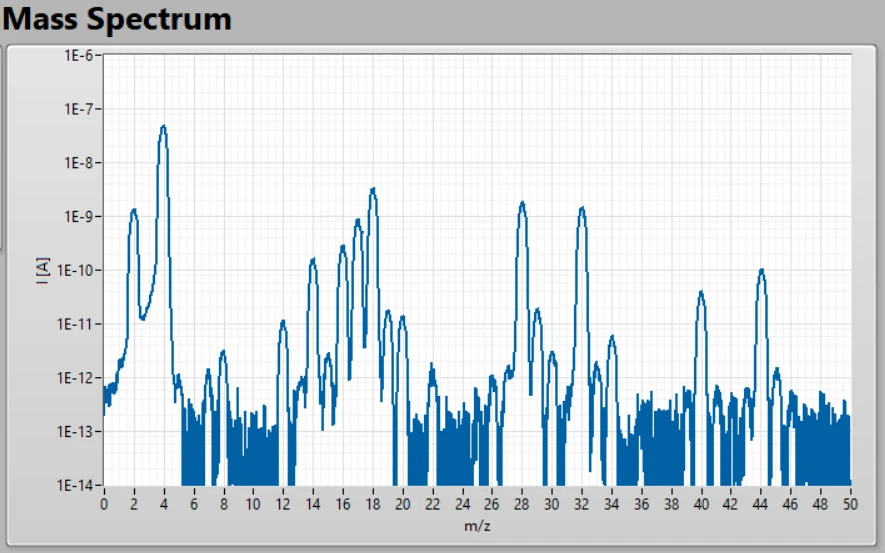
Figure 7 caption: Spectra in air and with H2O drop with SEM on and off. Note that the intensity is shown on a log scale and the y-scale is different between SEM on and off. (a) air, SEM off (b) air, SEM on (c) H2O drop, SEM off (d) H2O drop, SEM on
(a) air, SEM off
(b) air, SEM on
(c) H2O drop, SEM off
(d) H2O drop, SEM on
When to tune
Generally, we recommend to check the peak positions ca. 1x a month by recording a mass spectrum at a high resolution over then entire mass range that you work with, e.g. with the chip open to air (or in an environment relevant for the user’s experiments). Before important measurements and especially when quantifying mass signals, additional tuning is recommended as a slight shift in peak position could result in major inaccuracies.
Following issues are typically related to improper tuning:
- If the M2 signal significantly scales with the M4 signal, tuning of M2 in the presence of H2 gas can help reduce the contribution of double-ionized He to M2.
- If all mass signal intensity is reduced as measured by the EM, EM tuning is recommended. If only some masses are affected, or if signal intensity as measured by the Faraday cup is reduced compared to previously measured (independent of the chip used), peak position tuning is recommended.
- Also if one or two signals (typically the high intensity masses related to the make-up gas or N2 from air jump between two discrete values as shown for M4 and M40 in figure 8, poor tuning can be the cause. In this case, peak position tuning is recommended with a particular focus on making sure that the position of the peak maximum is stable for multiple scans.
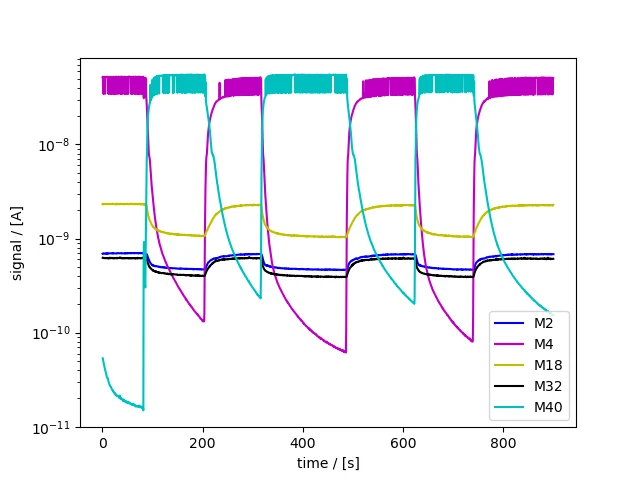
Figure 8 caption: Noisy He and Ar signal indicating that tuning is necessary.