

Soft ionization
EC-MS Technical notes #7
- Last updated

Introduction
Before gases can be analyzed in a mass filter, they must first be ionized in an ion source by means of electron bombardment (Figure 1). Electrons are emitted from an electrically heated cathode (filament). A voltage is applied between anode and cathode, which acceler-ates the electrons. Neutral gas molecules that are present in the formation space between the anode and cathode are ionized by collisions between electrons, forming single and multiple positive ions. The energy of the colliding electrons exerts a significant influence on both the number and type of ions that will be formed. A schematic illustration of the ionization process is shown in Figure 1, whereas a technical drawing of an open ionization source, as found in the EC-MS, is shown in Figure 2.
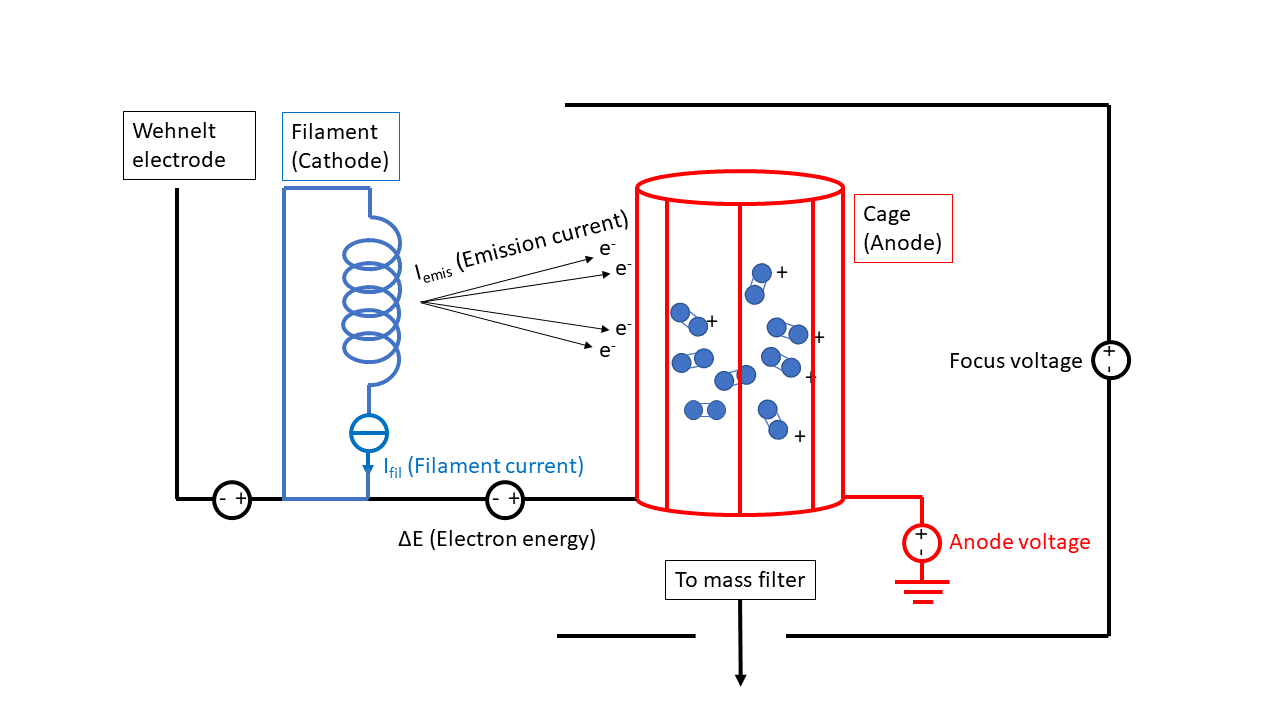
Figure 1: Schematic of ionization source with relevant definitions
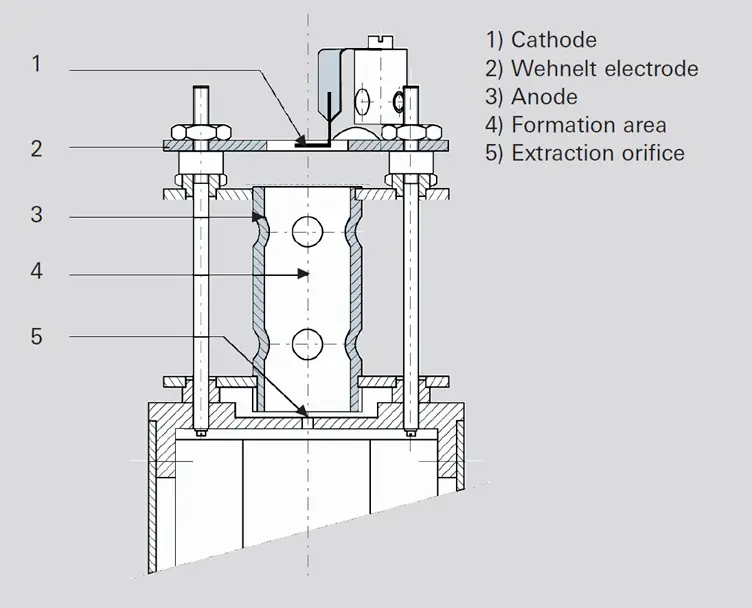
Figure 2: Open ionization source schematic. Reproduced from Pfeiffer Vacuum Know How book [1].
Ionization of the neutral particles commences at a minimum electron energy of between 10 and 30 eV (appearance potential). The number of formed ions (i.e., the ionization cross section) quickly increases as electron energy rises (acceleration voltage), reaches a max- imum at 50 to 150 eV depending upon the type of gas in question, and slowly declines again as energy continues to rise (Figure 3). Because the ionization cross sections for most molecules peak around 50 to 150 eV, electron energies between 70 and 100 eV are typically used as default setting in mass spectrometers. “Hard ionization” techniques are processes which impart high quantities of residual energy in the subject molecule invoking large degrees of fragmentation (i.e., the rupture of bonds removes the excess energy, restoring stability to the resulting ion). The resulting “cracking pattern” thus contains signals at m/z lower than that of the parent molecule. For instance, a mass spectrum of water acquired with an electron energy of 70 eV contains the following components:
• m/z=18: main water peak
• m/z=17: OH⁺ peak
• m/z=16: O⁺ peak
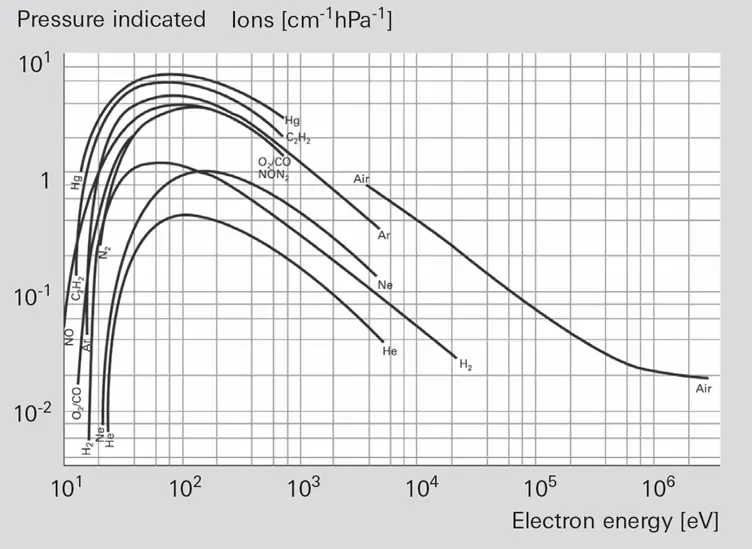
Figure 3: Ionization cross section as a function of electron energy. Reproduced from Pfeiffer Vacuum Know How book [1].
In contrast to “hard ionization”, “soft ionization” refers to the processes which impart little residual energy onto the subject molecule and as such result in little fragmentation. Low fragmentation may enable distinguishing overlapping signals. For example, in mixtures of water and ammonia the main ionization peak for ammonia (NH₃, m/z=17) overlaps with one of the water fragmentation peaks (associated with the OH⁺ ion). Mass spectra of pure H₂O and of a 1.0 M NH₃ aqueous solution are shown in Figure 4a and b, respectively. Spectra were acquired with the Spectro Inlets EC-MS, operated at electron energies between 15 and 22 eV with an emission current of 500 µA. In Figure 4a, the signal associated with the water fragment at m/z=17 is suppressed at electron energies below 20 eV. Thus, in Figure 4a, the signal at m/z=17 can be solely attributed to ammonia at electron energies below 20 eV.
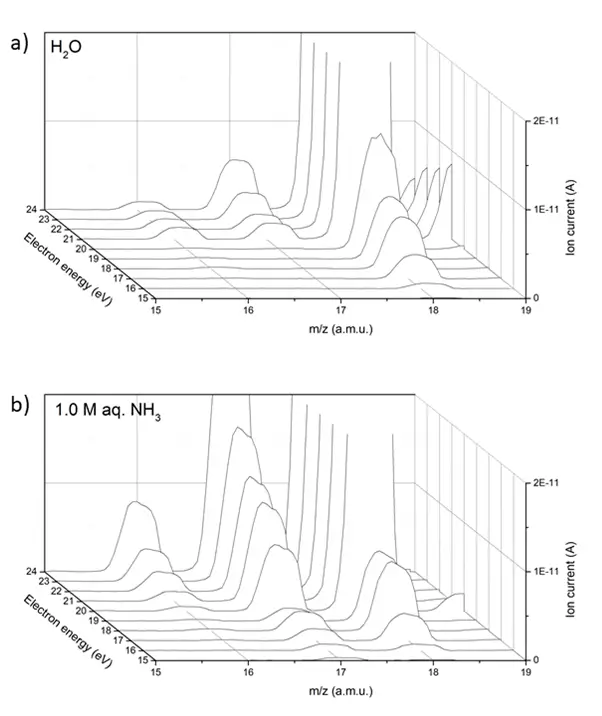
Figure 4: Mass spectra of (a) water and (b) ammonia in water. Spectra were acquired using the Spectro Inlets EC‐MS. The EC‐cell was mounted on the microchip and the liquid sample was injected in the cell with a glass syringe. Dwell time = 1 s, resolution = 25 points/amu, emission current = 500 μA
EC‐MS operation at different electron energies
Warning: do not change electron energy without changing other ionization parameters first and without having read this note.
Warning: Damage to the instrument as a result of ionization parameter manipulation is at own risk.
There are four main instrument parameters controlling the ionization process, highlighted in Figure 1: • Electron energy: the kinetic energy of the electrons emitted by the filament and available for ionization, measured in eV. Such kinetic energy is imparted to the electrons by the potential difference between anode and cathode. • Emission current: the current of electrons emitted by the filament, measured in Ampere. • Filament current: the current flowing through the filament, responsible for thermionic emission of electrons, measured in Ampere. • Anode voltage: the anode potential vs ground, measured in Volts. Such ionization parameters are controlled by the electronics in the mass spectrometer. Electron energy and emission current can be read and set by the user, whereas the filament current is internally regulated by the MS electronics, can be read but cannot be directly set by the user. Ionization parameters are interdependent. Because of the ionization source design and governing physics, lowering the electron energy causes the filament current to increase. Also, higher emission currents cause filament current to increase. In general, higher filament currents result in a hotter filament. Too high filament temperature causes filament degradation and ultimately failure. The manufacturer recommends operating the filament below a maximum safety current of 3.5 A to preserve filament lifetime. As of now, modifying the ionization parameters can only be done using Pfeiffer Vacuum’s proprietary software, PV MassSpec. A software update is planned to enable ionization control in Zilien.
Anode voltage
The anode voltage plays a fundamental role in achieving low electron energies. Figure 5 shows that low electron energies and high emission currents can only be obtained at low anode voltages. The lowest available anode voltage with the PrismaPro is 80 V. To work with low electron energies, the anode voltage must be set to 80 V. In Figure 5, the increase in filament current at low electron energies is shown.
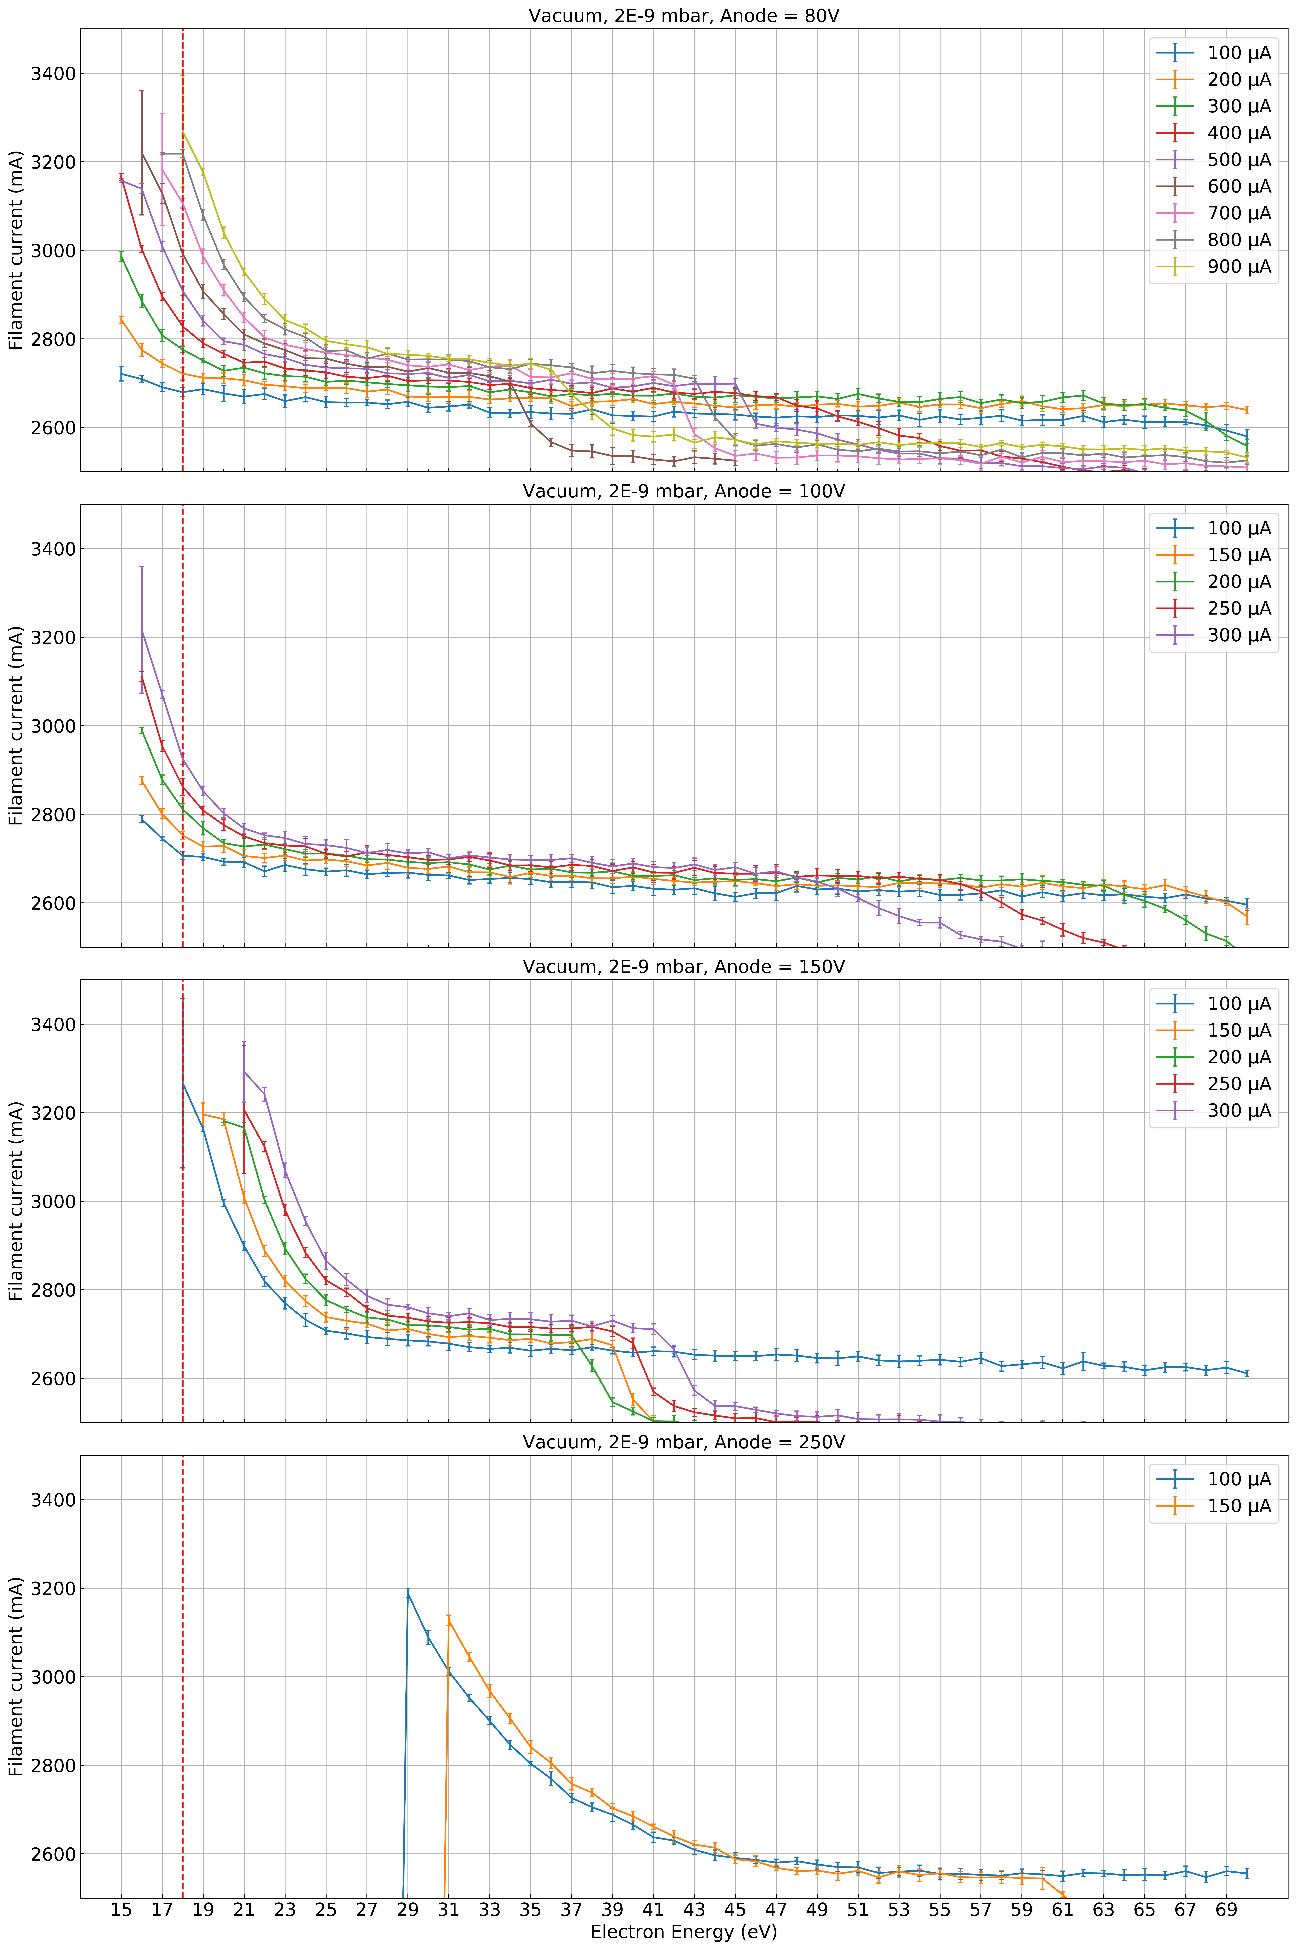
Figure 5: Effect of anode voltage on filament current vs. electron energy distributions at different emission currents. The red dashed line at 18 eV is shown to guide the eye at an electron energy where the m/z=17 signal of ammonia is entirely attributed to ammonia and no contribution is given by the OH⁺ water fragment
Filament current vs electron energy curves
In Figure 6 and Figure 7, filament current vs electron energy curves are shown for different emission currents and different atmospheres. The data reported in the two figures is the same, grouped to highlight emission energy dependency (Figure 6) and atmosphere dependency (Figure 7), respectively. Data was acquired with the EC‐MS using an anode voltage of 80 V. Vacuum curves were acquired with V5 closed. Air curves were measured with the mass spectrometer open to the membrane chip, and the chip exposed to air. Water and dimethoxyethane (DME) curves were measured coupling the EC‐cell onto the chip and injecting each liquid in the cell, respectively. Soft
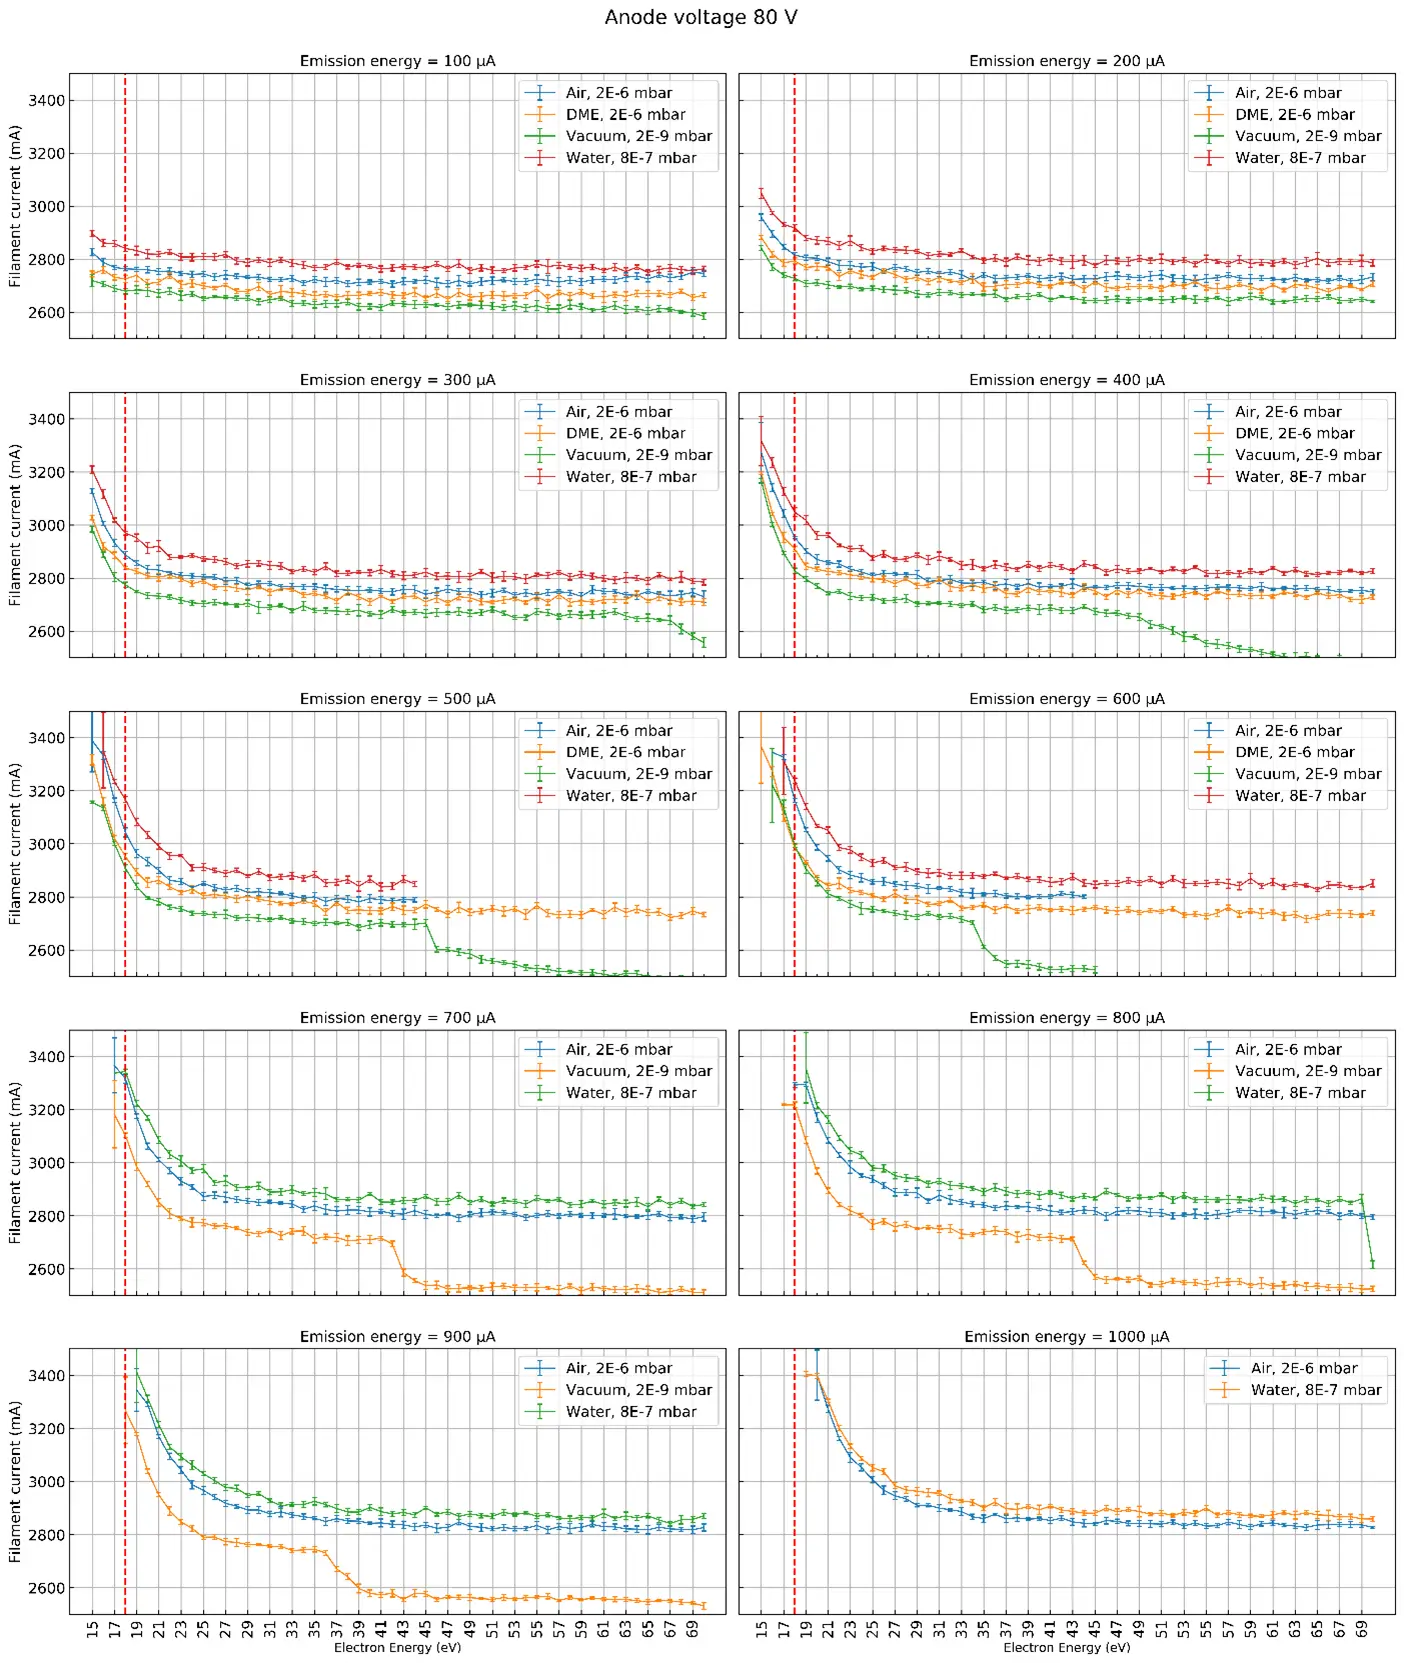
Figure 6: Filament current vs. electron energy curves for different emission currents and different atmospheres. Data is grouped to highlight the emission current dependency. All data is acquired with an anode voltage of 80 V. The red dashed line at 18 eV is shown to guide the eye at an electron energy where the m/z=17 signal of ammonia is entirely attributed to ammonia and no contribution is given by the OH⁺ water fragment.
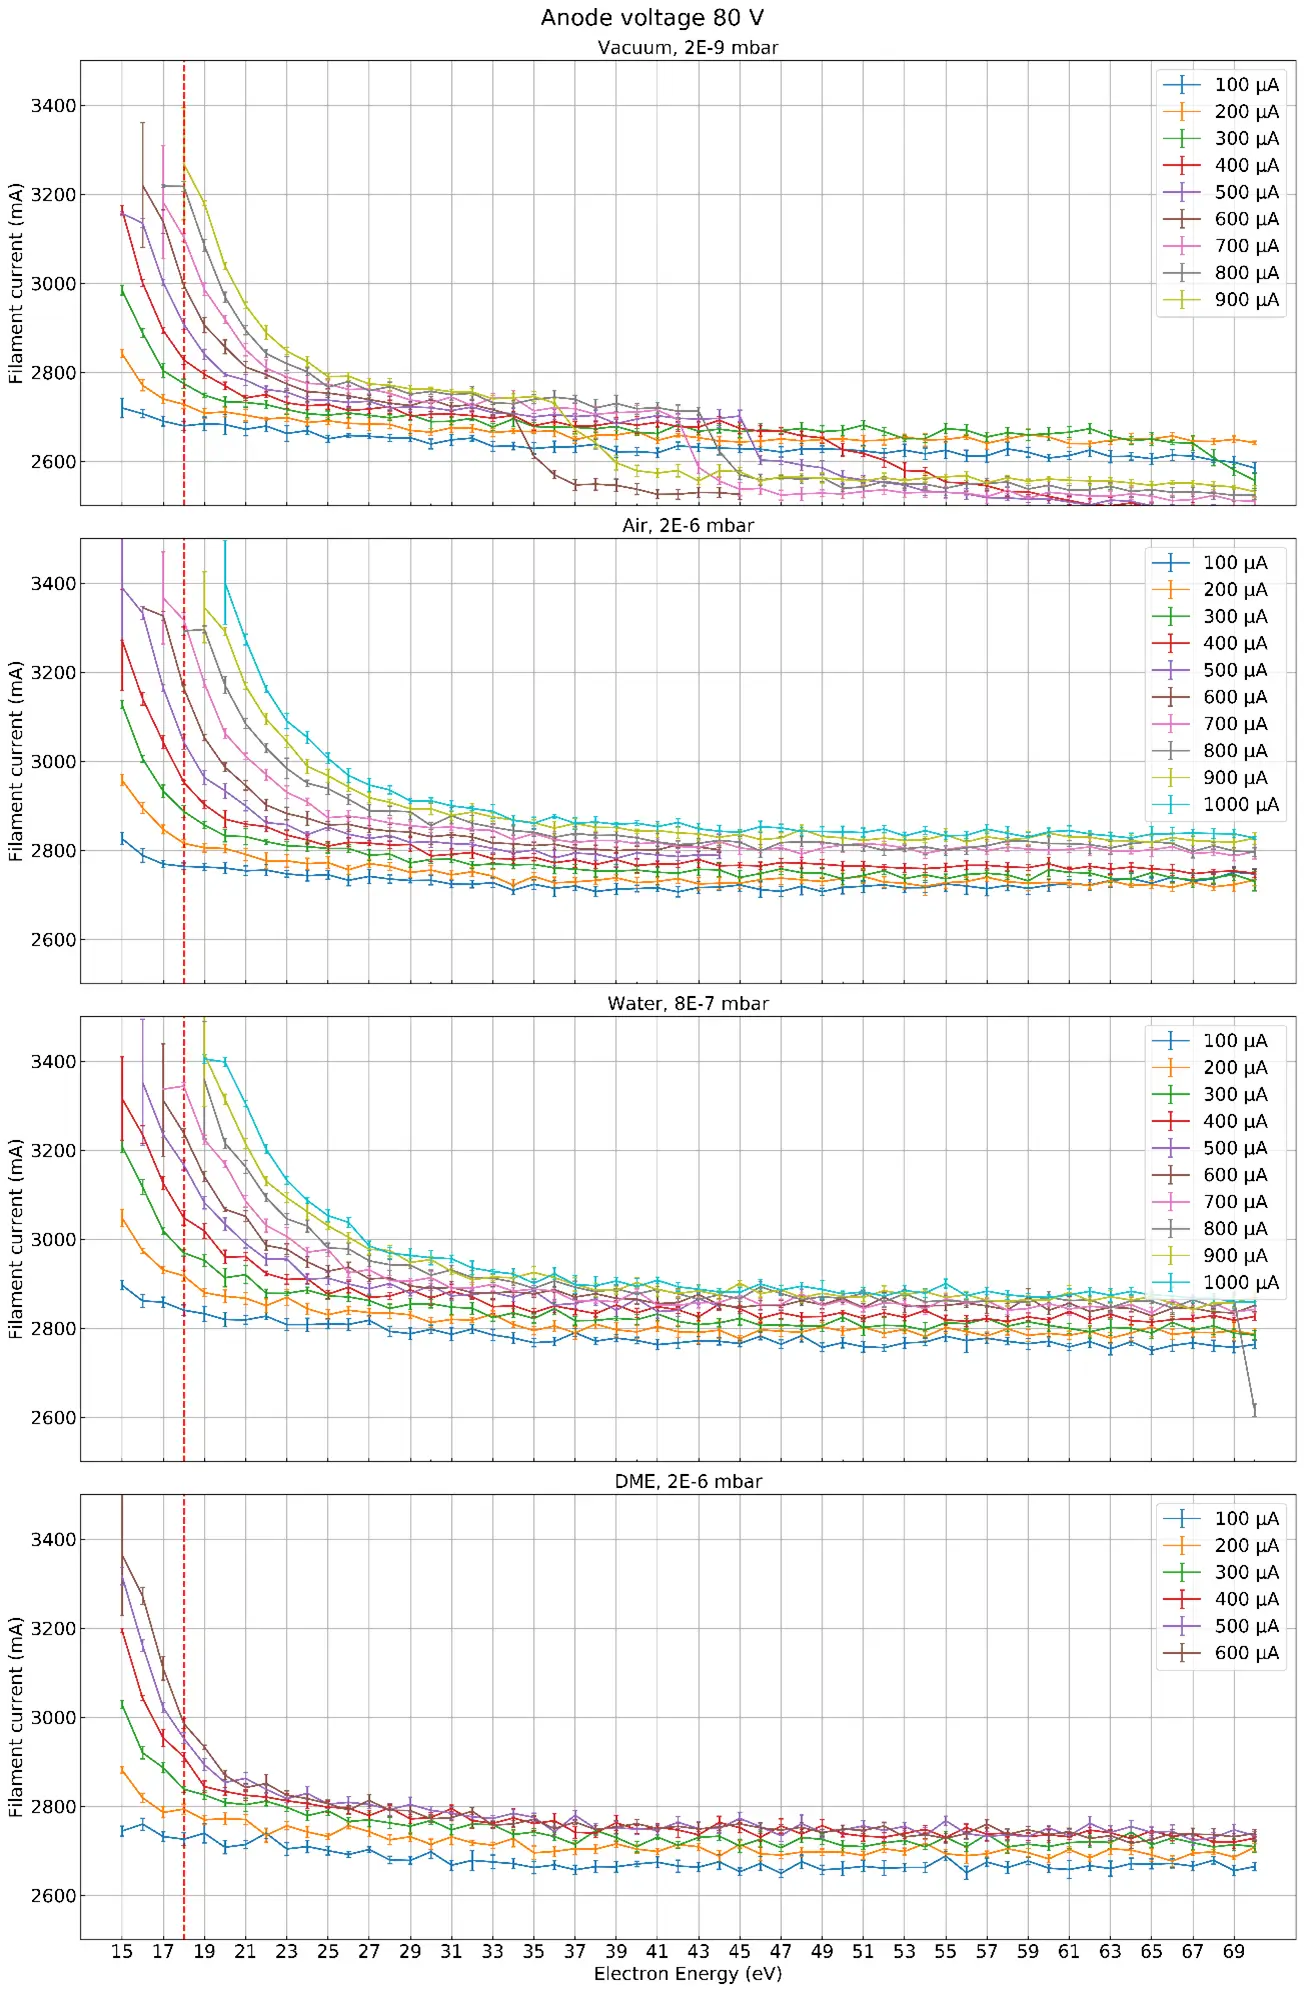
Figure 7: Same data as in Figure 6, regrouped to highlight atmosphere dependency.
How to safely change ionization settings in the mass spectrometer
There is no way of reading the filament current in PV MassSpec, so the user must refer to Figure 6 and Figure 7 in order to select a safe operation setting. The filament must be operated below 3.5 A, otherwise it may suffer catastrophic failure. As a rule of thumb, the filament should be operated at a setting where the filament current vs electron energy curve is not steep. Staying below 3.2 A is advised. To select an appropriate setting follow
these steps:
(i) Choose the desired electron energy
(ii) Locate the chosen electron energy in Figure 6 or Figure 7
(iii) Find the highest emission current that can be obtained at the chosen electron energy while staying in the safe operative zone (curve not steep, best below 3.2 A)
(iv) Write down the operation parameter settings (anode voltage, emission current, electron energy)
Warning: do not change electron energy without changing other ionization parameters first and without having read this note.
To safely input the chosen parameters, follow these steps:
(i) Open PV MassSpec
(ii) Click on Tune
(iii) Turn emission off
(iv) In the Tune tab ﴾Figure 8﴿, edit the parameters in the following order
(a) Lower emission current to 0
(b) Change anode voltage ﴾set to 80 V for soft ionization﴿
(c) Change electron energy
(d) Set emission current to desired value
(v) Turn emission on
(vi) Check peak tuning
Expect lower signals when using lower emission currents. Decrease in signal intensity can be compensated for by using longer dwell times and increasing electron multiplier voltage. Refrain from increasing the electron multiplier above approximately 1500 V to preserve multiplier lifetime. Remember to restore the original multiplier value when reverting to default ionization settings. The lowest electron energies achievable with a threshold filament current of 3500 mA are summarized in Figure 9 as a function of emission current and for different atmospheres. For example, it can be observed that the threshold electron energy of 18 eV can be obtained in all atmospheres at emission currents as high as 8̃00 μA. Caution must be always exercised not to exceed 3500 mA filament current.
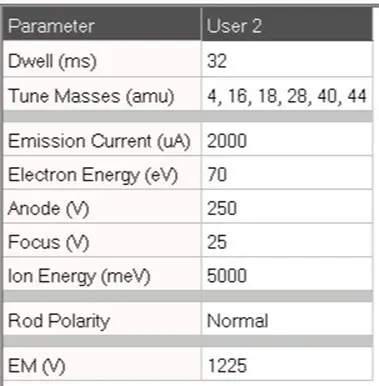
Figure 8: The Tune tab in PV MassSpec, used to change ionization parameters
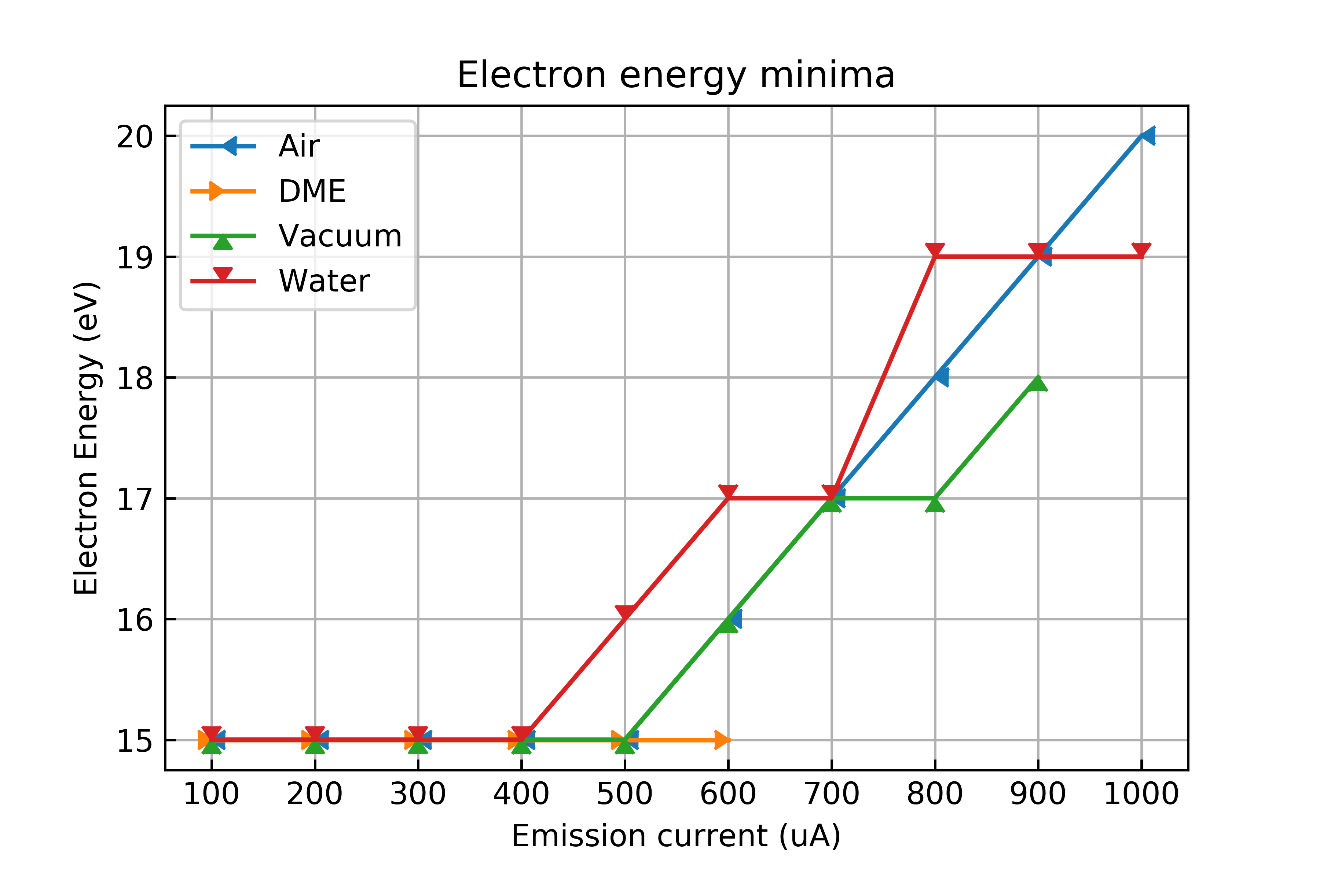
Figure 9: Minimum electron energy achieved at each measurement set with a threshold filament current of 3500 mA.
References
[1] Pfeiffer Vacuum. Ion sources. 2021.