Oxygen evolution reaction - OER - using EC‐MS system
EC‐MS Application Note #4
Introduction
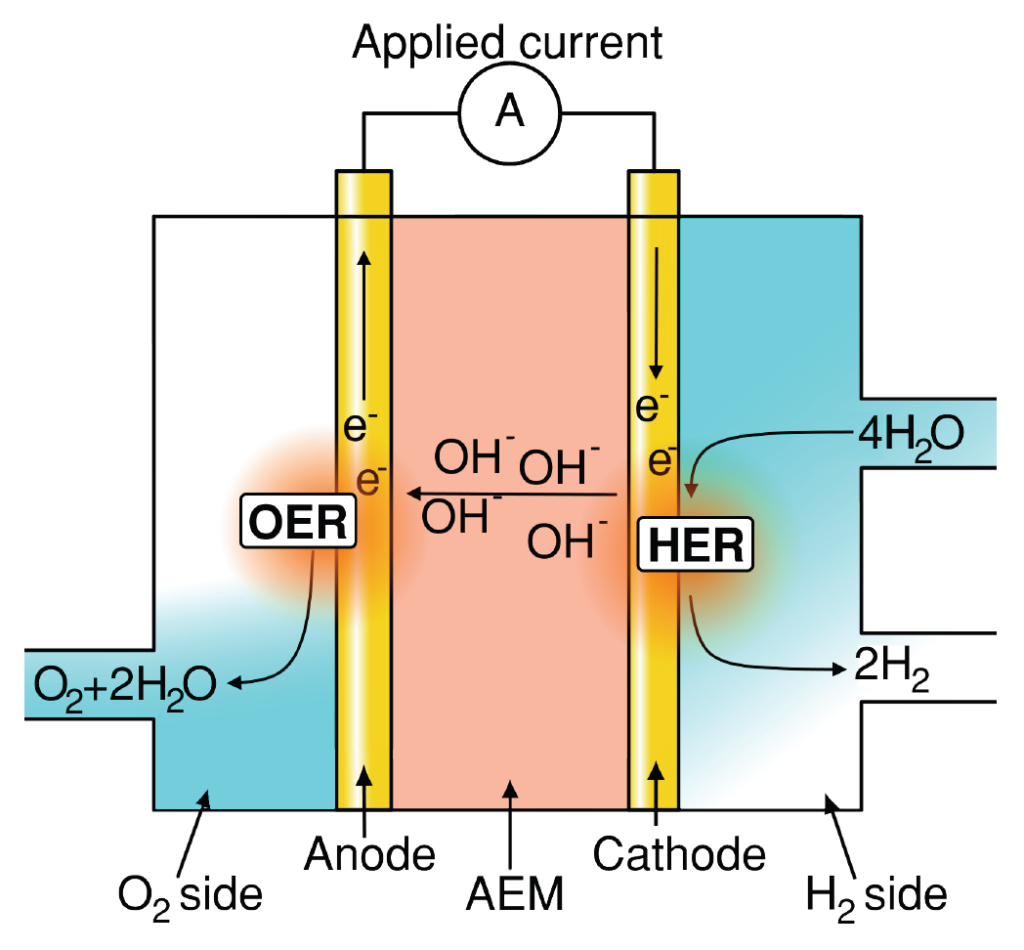
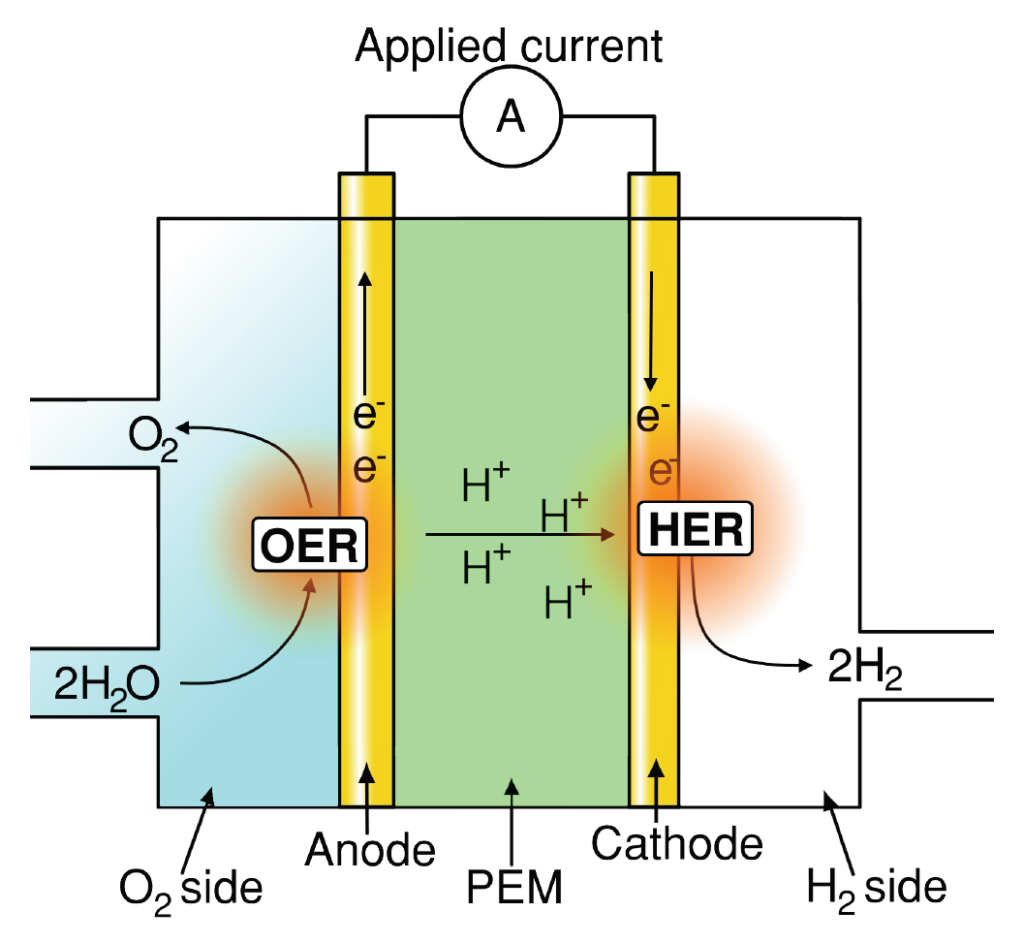
Understanding and improving material performance for oxygen evolution reaction (OER) is paramount for many renewable energy storage and conversion schemes proposed for a sustainable economy [1]. Hydrogen generation using water electrolysis and CO2 upconversion through the CO2 reduction reaction (CO2RR), provide promising renewable energy conversion options into fuels and valuable chemicals. In both processes, OER occurs as one of the two half‐cell reactions, as illustrated for water electrolysis in figures 1a and b.
Interested?
Do not hesitate to contact us for a quotation or a talk and presentation of our product
(a)
(b)
![﴾c﴿ Typical representation of OER overpotential in a PEM electrolyzer stack, adapted from [2]. Note, typical OER overpotential losses in AEM electrolyzers are only ∼25% [3] however with significant additional Ohmic and HER associated loses when compared to PEM‐based counterparts.](https://spectroinlets.com/wp-content/uploads/2024/03/1c-1024x954.png)
(c)
Figure 1: Schematics of (a) AEM electrolyzer operating principle. (b) PEM electrolyzer operating principle. (c) Typical representation of OER overpotential in a PEM electrolyzer stack, adapted from [2]. Note, typical OER overpotential losses in AEM electrolyzers are only ∼25% [3] however with significant additional Ohmic and HER associated loses when compared to PEM‐based counterparts.
In this application note, we wish to highlight the benefits that can be gained by coupling OER catalyst studies with an EC‐MS elucidating this important half‐cell reaction. The exact mechanisms through which OER proceeds are still being contested, and can often be considered catalyst dependent. In that context various isotope labeled studies have been suggested in which the catalyst was pre‐oxidized with 18O and then studied using EC‐MS [4, 5]. Product detection and complete quantification is enabled by the EC‐MS allowing the OER using EC‐MS system | EC‐MS true OER activity to be measured ‐ something which may be exceedingly difficult using traditional techniques. In the following, we first provide a brief background to OER research and proceed to showcase the EC‐MS capabilities for OER investigation with four simple examples, followed by a brief literature review.
Background
OER can occur both in alkaline and acidic environment and follows the half‐cell reactions given in equation 1.
4OH− → 2H2O + O2 + 4 e− (AEM OER, alkaline)
2 H2O → O2 + 4 H+ + 4 e− (PEM OER, acidic) (1)
Different electrocatalysts are typically used in alkaline and acidic systems: Inexpensive, stable and abundant OER catalysts typically based on Nix(CoyFez) perform excellent for alkaline OER. They are used in traditional alkaline electrolysis as well as the more recently developed anion exchange membrane (AEM) electrolyzer illustrated in see figure 1. In acidic electrolyzer ystems on the other hand, significant issues arise due to material instability at low pH (catalyst oxidation and dissolution). Currently, the only reasonably stable and active OER catalysts for PEM electrolysis are based on IrOx. However, due to its high price and scarcity, replacing this catalyst is a prerequisite for up‐scaling PEM electrolysers to widespread commercial applications. Given the present status of alkaline‐ and acidic polymer electrolyte membrane technologies most OER catalyst studies focus on:
Alkaline OER: Finding nano‐materials which constituents (e.g. Fe or Co) are unable to crossover to the cathode side disrupting the hydrogen evolution reaction – HER – or ion transport while maintaining high OER activity, i.e. low OER overpotential.
Acidic OER: Identifying stable, abundant/inexpensive and electrically conductive materials exhibiting low OER overpotential (see figure 1c) and which elemental constituent do not pose additional crossover issues in terms of membrane and HER deterioration.
Besides studies of materials for these two cases, numerous studies concern the deterioration of support materials both under acidic, neutral and alkaline conditions. For a more in‐depth overview to basic OER electrocatalysis we refer readers to the extremely rich OER literature.
Examples of OER studies using the EC‐MS
For this document, four catalyst systems were investigated using the EC‐MS. They were chosen to: (i) Show consistency with known electrolyte effects for OER [6, 7]. (ii) Showcase the alkaline capabilities of the EC‐MS using non‐aqueous chips. (iii) Highlight how the ECMS provides insights that purely electrochemical techniques cannot. These systems are:
1‐3 PtPoly ﴾PINE inst., see [8] for proper preparation﴿ in 0.1MHClO4, 0.5MH2SO4 or 0.5M KOH electrolyte, respectively.
4 Glassy carbon (GC) (HTW, Sigradur® G) in 0.1M HClO4 electrolyte.
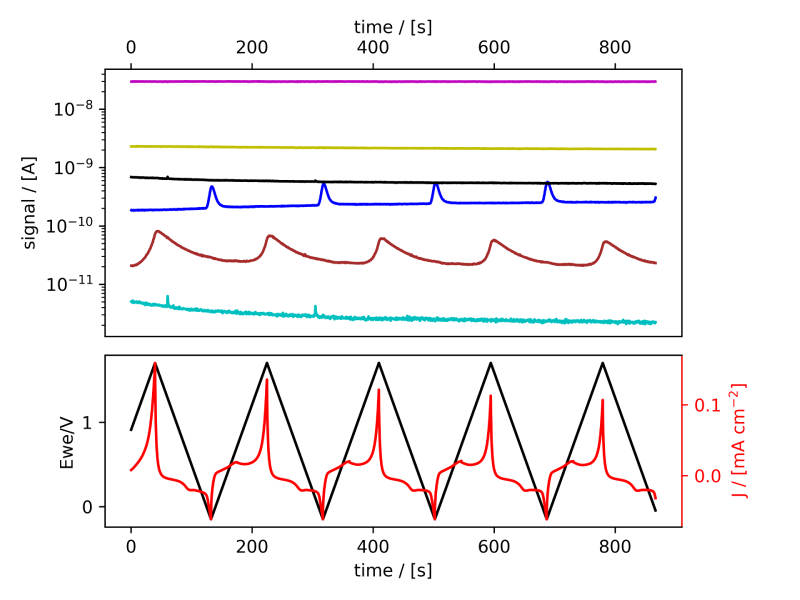
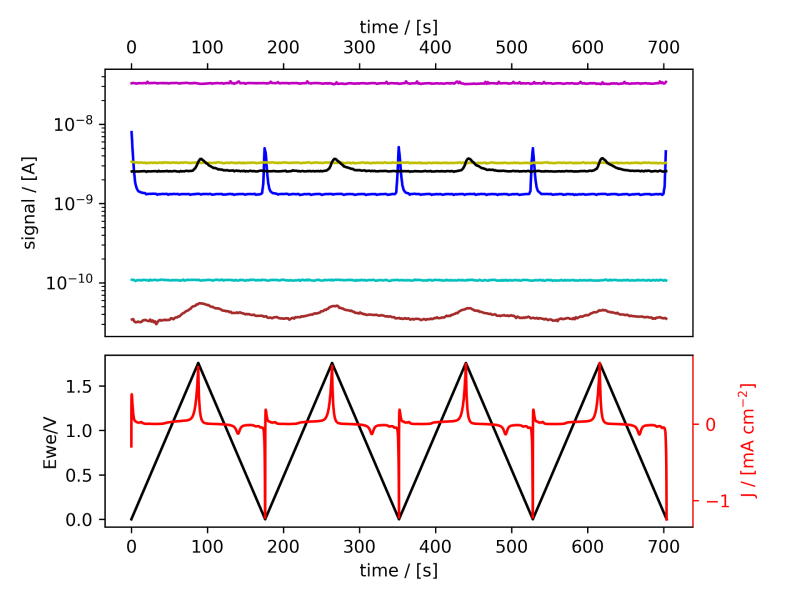
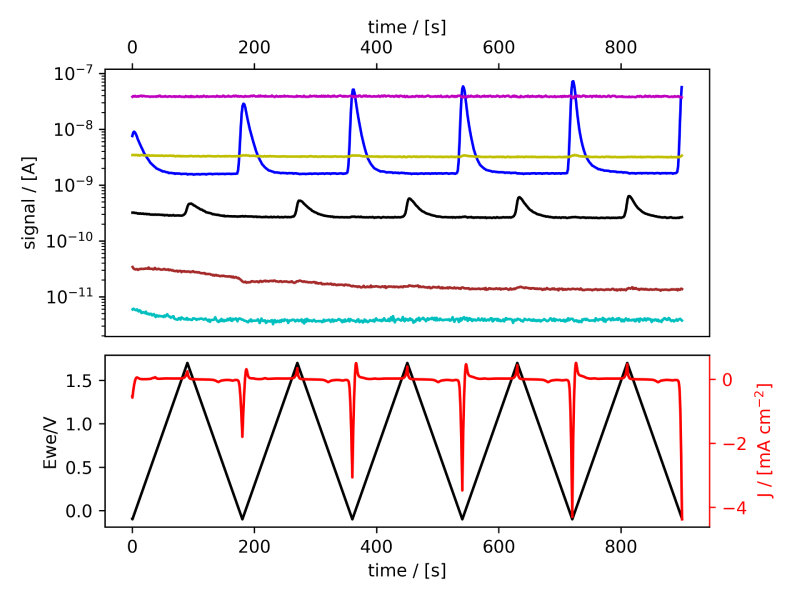
These systems were tested following the procedure established in Benchmark Measurements EC‐MS Technical Note #2 and prepared by cleaning the EC‐MS cell in ”Piranha” following Cleaning Procedures EC‐MS Technical Note #12. In this section the EC‐MS responses recorded while doing cyclic voltammetry (CV) on the samples are discussed. The experimental data is shown in figure 2 and 3, in which signals vs. time and signals vs. potential are presented, respectively.
(a)
(b)
(c)
(d)
Figure 2: EC‐MS plots (room temperature, 20mV/s, He‐saturated, not IR‐compensated) of (a) PtPoly in 0.1M HClO4. (b) PtPoly in 0.5MH2SO4. (c) PtPoly in 0.5MKOH. (d) GC in 0.1MHClO4. Masses correspond toM2 = H2, M4 = He, M18 = H2O, M28 = N2/CO, M32 = O2 and M44 = CO2.
(a)
(b)
(c)
(d)
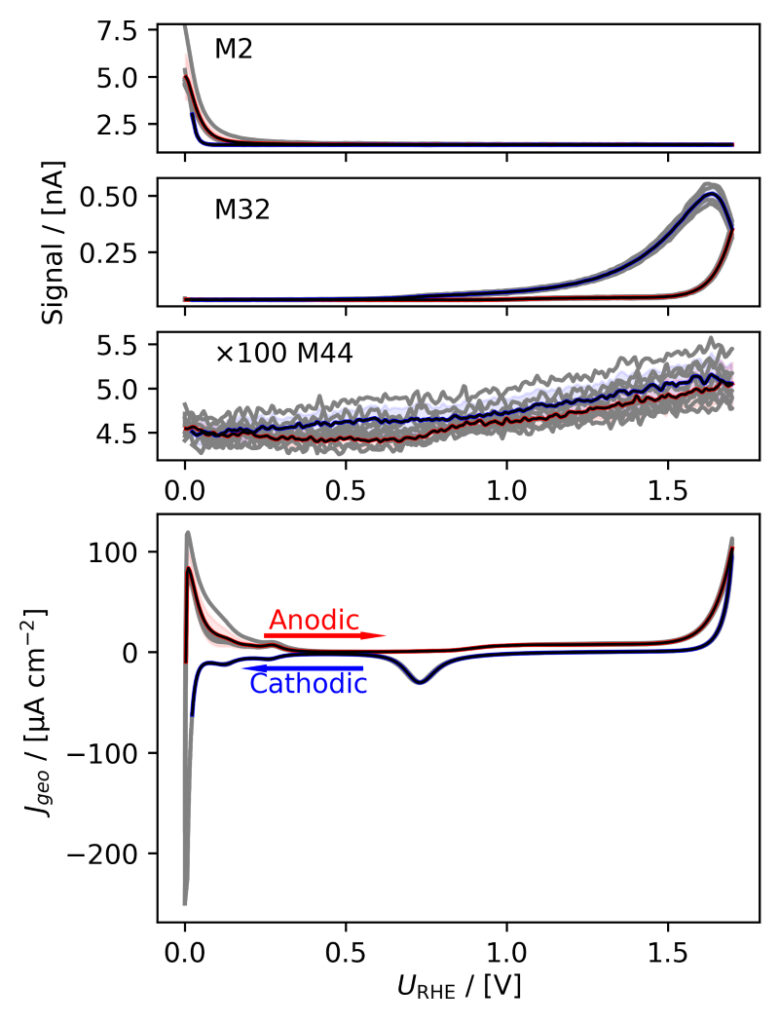
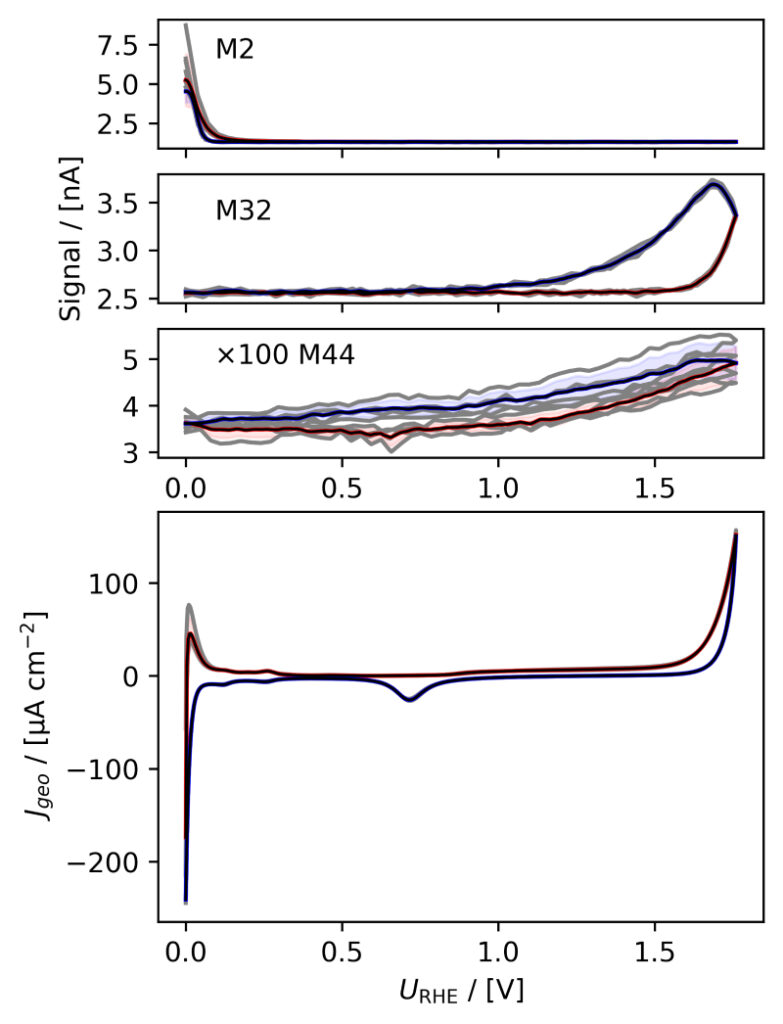
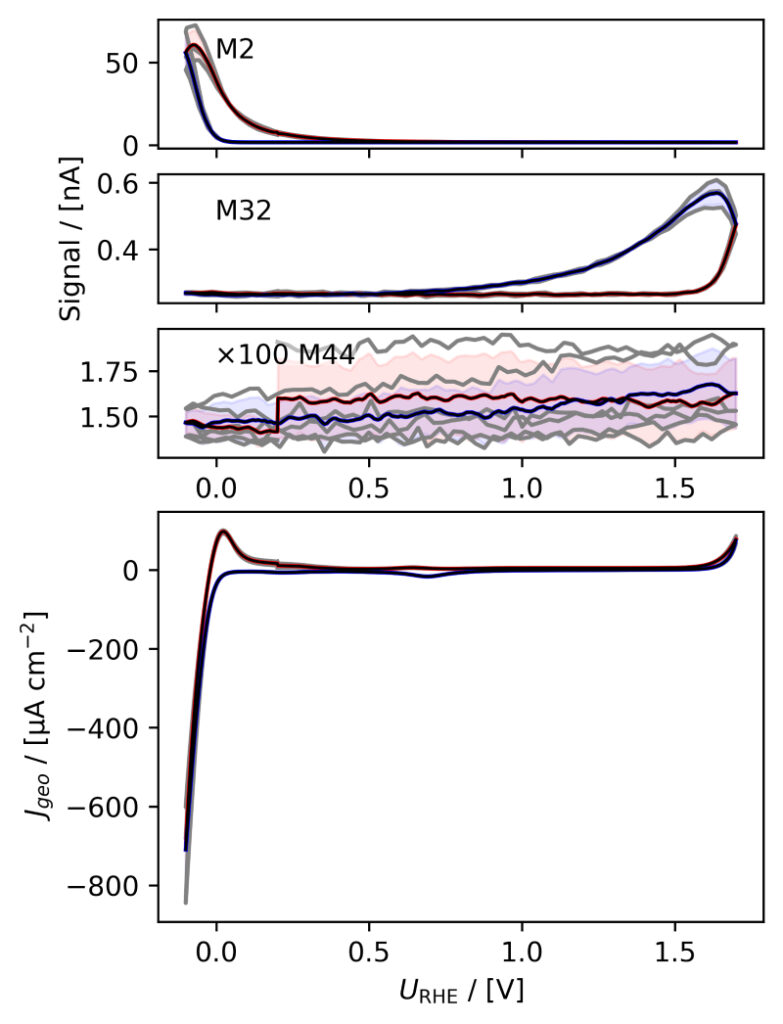
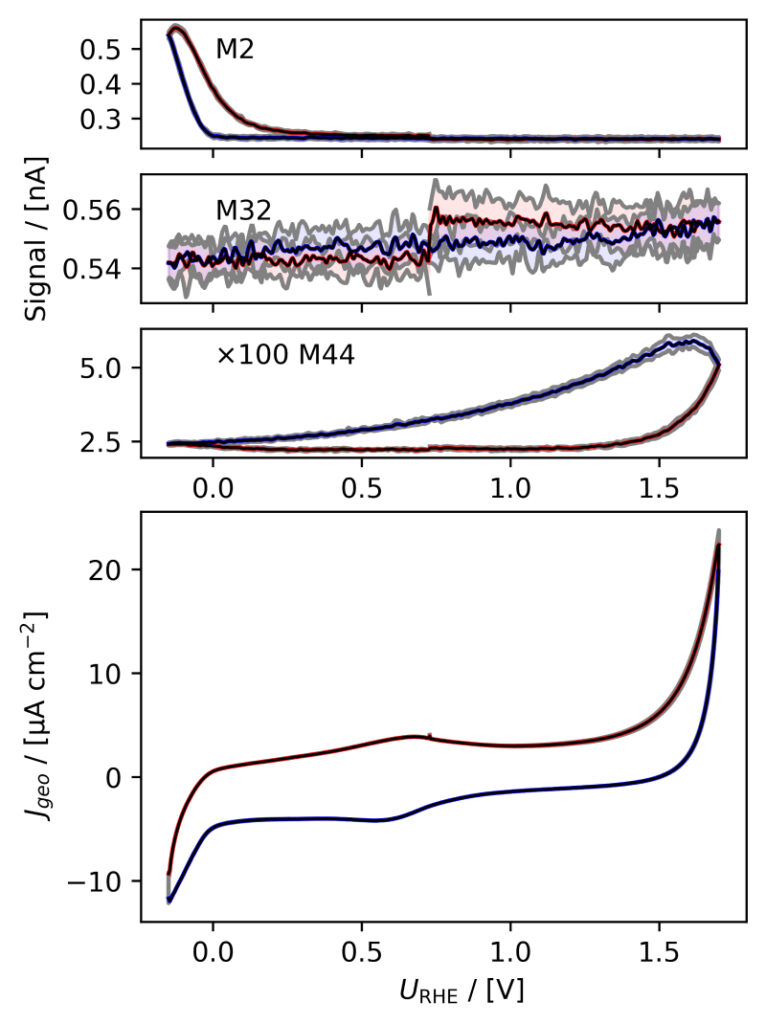
Figure 3: Averaged, IR compensated CVs of EC‐MS experiments (from figure 2) co‐plotted with M2 = H2, M32 = O2 and M44 = CO2 signals. (a) PtPoly in 0.1M HClO4. (b) PtPoly in 0.5M H2SO4. (c) PtPoly in 0.5M KOH. (d) GC in 0.1M HClO4. All taken at room temperature and 20mV/s in He‐saturated electrolytes. Note, averaging background noise, as is the instance for the M44 and M32 signal for the PtPoly in KOH and the GC electrode, respectively, results in noisy MS signal curves.
From figure 2 it is noticed that at cathodic (i.e. low) potentials significant currents associated with HER (seen as M2 peaks) are observed. Even on the GC electrode hydrogen is formed, albeit at significant lower potentials than on the PtPoly (in good agreement with work by Stephens et al. [9]). Importantly, figure 2 also highlights significant OER activity on PtPoly in all three electrolytes, seen as an increase in the M32 signal (associated with O2), when going to sufficiently anodic
(i.e. high) potentials. On the GC sample, however, no increase in M32 signal is observed, despite a significant increase in current at anodic potential. At the same time, significant M44 signal increase (associated with CO2 production) is observed alongside the increase in current. Pt also shows some increase in M44 signal when going to potentials above 0.7 VRHE, but to a far lesser extent. To properly capture the potential dependence of the HER‐, OER‐ and CO2 production onset the results of figure 2 have been averaged using the Python package ixdat, see figure 3. Figure 3 again clearly showcases HER and OER for PtPoly while GC exhibits significant lower propensity towards HER and none towards OER. Rather, GC presents notable CO2 production. Essentially, going to sufficiently anodic potentials with GC suggest that once O2 can bind to carbon it is thermodynamic more favourable to form CO2 rather than O2. From figure 3 three main conclusions can be drawn:
1) In some scientific literature, when researchers utilize carbon‐based and/or carbonsupported OER catalysts the observed current above 1.23 eV is often indiscriminately, assigned purely to OER. However, the EC‐MS data shows direct evidence that this is not the case ﴾CO2 production on GC﴿. Thus, to determine true OER current of such catalysts, performing gas analysis is crucial.
2) Pt (and also other non‐carbon‐based systems) exhibit slight M44 (CO2) evolution above 0.7 VRHE, which arise from trace amounts of carbon impurities of the system. These originate e.g. from electrolyte ”ageing” and/or adsorption of adventitious adsorbed carbon material introduced from the surrounding ambient environment during assembly/transfers etc. The CO2 signal from the Pt system therefore provides the user with a very good idea of the degree of carbon contamination of their electrochemical system and/or catalyst material. Being able to determine contamination directly from the EC‐MS data is a huge benefit when testing novel nanocatalysts produced under rather carbon rich conditions.
3) Also dissolution of catalyst material can be an issue when determining the faradaic efficiency (FE) towards OER. To evaluate the true FE, two approaches are available: i) Quantify dissolution and/or oxidation by other means e.g. by using ICP‐MS to determine metal concentrations and integrating reduction peaks to estimate the amount of surface oxidation; or ii) Follow theM32 signal using EC‐MS, calibrate the system to quantify the O2 signal and compare the result with the total charge transfer. This is described in the EC‐MS quantification EC‐MS Application Note #2 and the available EC‐MS based OER (or OER adjacent) literature [3, 4, 9–17]
OER relevant studies using the EC‐MS in literature
Significant insight on OER can be acquired using Spectro Inlets EC‐MS system ‐ insight relevant both for commercial development of OER technologies melectrolyzers, nanomaterial producers etc.﴿ as well as for the scientific electrocatalytic community as a whole. Examples of the unique insights provided by the EC‐MS will be presented in the following along with highlighted publications mdemonstrating specific user cases.
Identification of OER current and specific turn‐over frequencies
The most obvious benefit of the EC‐MS for investigating OER electrocatalysis is its inherent ability to quantify the O2 mass signal and subsequently correlate the mamount of O2 evolved to the anodic current. This allows for accurate mdetermination of the true OER onset potential [10, 13, 14] and calculation of turn‐over frequencies (TOFs)[4]. At the same time, also other volatile reaction products from parasitic reactions can be detected quali‐ and quantitatively, such as CO2 from carbon oxidation [10, 12, 16]. Implicitly, this kind of quantitative
experiments can also give insights to catalyst stability, for instance when studying IrOx and RuOx ‐ two very active OER catalysts in acid. By employing the EC‐MS one can, by comparing integrated oxygen charge and current, evaluate to what extent charges for the different catalysts actually produce oxygen or undergo other oxidative processes [10, 13, 14].
Mechanistic OER studies through isotope labeling
Various mechanistic models exists for explaining activity in OER catalysis. An obvious question in this regard is whether the evolved oxygen arises directly from the water or it arises from dissociation of an oxide which is then re‐oxidized after the release of O2. Such complex mechanism can crudely be simplified as indicated here for a metal‐oxide (MxOy):
MxOy + 2 H2O → MxOy + O2 + 4 (H+ + e −)
MxOy + H2O → MxOy−1 + O2 + 2 (H+ + e −)
(2)
While the two pathways of eqn. (2) both produce molecular oxygen as the end product, the pathways are not equivalent. The latter scheme requires an increase, in the metaloxide catalyst oxidation number followed by partial reduction. By selectively pre‐oxidizing mthe MxOy catalyst with labeled oxygen (18O) one can evaluate whether oxygen produced during OER contains mainly M32 or M34 from 16O2 or 16O18O, respectively. The ratio of produced isotope labeled oxygen can then be compared with non‐labeled equivalents to determine whether or not oxygen from the metal oxide participates in the OER mechanism [4, 10] and also gives implicit insights to the stability of oxides for OER.
Insight to support and electrolyte stability
Another extremely important aspect of OER which can be elucidated by the EC‐MS concerns the support and the support materials’ interaction with the catalyst. For instance, carbon materials are known to degrade significantly above 1.3 VRHE. Essentially, carbon degradation occurs as oxidization to CO2 (M44) which can be directly observed using the EC‐MS and has been the topic of several publications [10, 12, 15, 16]. Besides investigating support stability the EC‐MS also allows direct evaluation of the electrolyte. In recent years the effects of the electrolyte on OER (e.g. varying anion‐ and cation concentrations, pH etc.) have been investigated [6, 7]. Some of these electrolytes are not particularly stable under as oxidizing conditions as those needed for OER. Hence, by adding certain components to an electrolyte one may, by just observing the electrochemical, current, erroneously count charge transfers arising from electrolyte oxidation and not OER. The EC‐MS uniquely gives researchers the possibility to measure O2 directly and thereby exclude contributions from the electrolyte to the current.
Summary
Here, we have demonstrated how simple OER investigations can be conducted using the EC‐MS system and given a brief introduction into mechanistic, isotope, stability and activity aspects relevant for OER.
We showed the M32 signal can be used to determine OER occurrence and how the EC‐MS is able to promote direct insights to fundamental reaction phenomena taking place on an electrode surface.
References
[1] S. Chu, Y. Cui, and N. Liu, “The path towards sustainable energy,” Nature Materials, vol. 16, no. 1, pp. 16–22, 2016. DOI: 10.1038/nmat4834.
[2] H. A. Gasteiger, S. S. Kocha, B. Sompalli, and F. T. Wagner, “Activity benchmarks and requirements for Pt, Pt‐alloy, and non‐Pt oxygen reduction catalysts for PEMFCs,” Applied Catalysis B: Environmental, vol. 56, no. 1‐2, pp. 9–35, 2005. DOI: 10.1016/j. apcatb.2004.06.021.
[3] M. R. Gerhardt et al., “Method—practices and pitfalls in voltage breakdown analysis of electrochemical energy‐conversion systems,” Journal of The Electrochemical Society, vol. 168, no. 7, p. 074 503, Jul. 2021. DOI: 10.1149/1945 7111/abf061.
[4] C. Roy et al., “Impact of nanoparticle size and lattice oxygen on water oxidation on NiFeOxHy,” Nature Catalysis, vol. 1, no. 11, pp. 820–829, 2018. DOI: 0.1038/s41929-018-0162-x.
[5] A. Grimaud et al., “Activating lattice oxygen redox reactions in metal oxides to catalyse oxygen evolution,” Nature chemistry, vol. 9, no. 5, pp. 457–465, 2017. DOI: 10.1038/ nchem.2695.
[6] A. Ganassin, V. Colic, J. Tymoczko, A. S. Bandarenka, and W. Schuhmann, “Noncovalent interactions in water electrolysis: Influence on the activity of Pt (111) and iridium oxide catalysts in acidic media,” Physical Chemistry Chemical Physics, vol. 17, no. 13, pp. 8349–8355, 2015. DOI: 10.1039/C4CP04791E.
[7] J. A. Arminio‐Ravelo, A. W. Jensen, K. D. Jensen, J. Quinson, and M. Escudero‐Escribano, “Electrolyte effects on the electrocatalytic performance of iridium‐based nanoparticles for oxygen evolution in rotating disc electrodes,” ChemPhysChem, vol. 20, no. 22, pp. 2956–2963, 2019. DOI: 10.1002/cphc.201900902.
[8] J. Clavilier, R. Faure, G. Guinet, and R. Durand, “Preparation of monocrystalline Pt microelectrodes and electrochemical study of the plane surfaces cut in the direction of the {111} and {110} planes,” Journal of Electroanalytical Chemistry and Interfacial Electrochemistry, vol. 107, no. 1, pp. 205–209, 1980, ISSN: 0022‐0728. DOI: 10.1016/S0022-0728(79)80022-4.
[9] R. P. Oates et al., “How to minimise hydrogen evolution on carbon based materials?” Journal of The Electrochemical Society, vol. 169, no. 5, p. 054 516, May 2022. DOI: 10. 1149/1945-7111/ac67f7.
[10] J. Huang, S. B. Scott, I. Chorkendorff, and Z. Wen, “Online electrochemistry mass spectrometry evaluation of the acidic oxygen evolution reaction at supported catalysts,” ACS Catalysis, vol. 11, no. 20, pp. 12 745–12 753, 2021. DOI: 10.1021/acscatal. 1c03430.
[11] K. Krempl et al., “Dynamic interfacial reaction rates from electrochemistry mass spectrometry,” Analytical Chemistry, vol. 93, no. 18, pp. 7022–7028, 2021. DOI: 10.1021/acs.analchem.1c00110.
[12] L. Moriau et al., “Enhancing iridium nanoparticles’ oxygen evolution reaction activity and stability by adjusting the coverage of titanium oxynitride flakes on reduced graphene oxide nanoribbons’ support,” Advanced Materials Interfaces, vol. 8, no. 17, p. 2 100 900, 2021. DOI: 10.1002/admi.202100900.
[13] S. B. Scott et al., “The low overpotential regime of acidic water oxidation part I: The importance of O2 detection,” Energy & Environmental Science, vol. 15, no. 5, pp. 1977–1987, 2022. DOI: 10.1039/D1EE03914H.
[14] S. B. Scott et al., “The low overpotential regime of acidic water oxidation part II: Trends in metal and oxygen stability numbers,” Energy & Environmental, Science, vol. 15, no. 5, pp. 1988–2001, 2022. DOI: 10.1039/D1EE03915F.
[15] S. B. Scott, J. Kibsgaard, P. C. Vesborg, and I. Chorkendorff, “Tracking oxygen atoms in electrochemical CO oxidation–part i: Oxygen exchange via CO2 hydration,” Electrochimica Acta, vol. 374, p. 137 842, 2021. DOI: 10 . 1016 / j . electacta . 2021 . 137842.
[16] M. Smiljanić et al., “Electrochemical stability and degradation mechanisms of commercial carbon‐supported gold nanoparticles in acidic media,” The Journal of Physical Chemistry C, vol. 125, no. 1, pp. 635–647, 2021. DOI: 10.1021/acs.jpcc.0c10033.
Interested?
Do not hesitate to contact us for a quotation or a talk and presentation of our product